Quantcast
Channel: EEP – Electrical Engineering Portal
Viewing all 1475 articles
Browse latest View live

Short-Circuit Switching Capacity Definition

$
0
0
Short-circuit Switching Capacity Definition

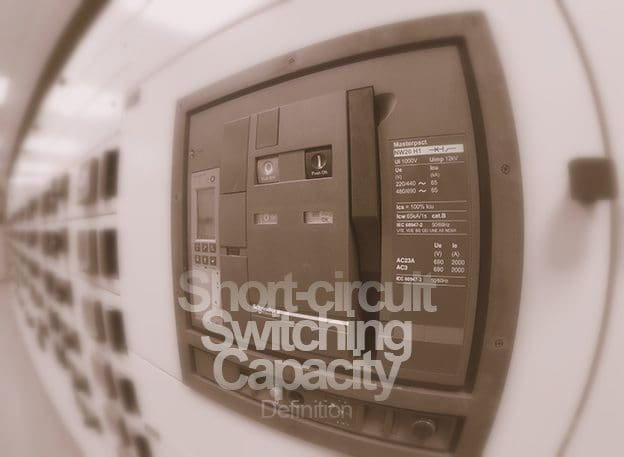
Short-circuit Switching Capacity Definition (photo by M. Diskovic)

What is the switching capacity?

The switching capacity is the r.m.s value of a current at a given power factor cosφ as well as a given rated voltage at which a switchgear or a fuse can still shut-off under specified conditions in an operationally safe way.

Both the short-circuit making capacity as well as the short-circuit breaking capacity of circuit breakers must be larger than or equal to the prospective short-circuit current at the place of installation.

If this is not the case, then a suitable backup protection (for example a fuse) should be provided to ensure the required switching capacity of the device combination.

Data regarding devices for backup protection are given in the technical documentation.


Rated short-circuit making capacity Icm

The rated short-circuit making capacity Icm is a quantity that according to regulations must be in a certain ratio to the rated ultimate short-circuit breaking capacity Icu and that has to be guaranteed by the device manufacturer.

This is not a variable that must be considered by the user, however it ensures that a circuit breaker is in the position to connect onto a short-circuit and to disconnect it subsequently.

Rated short-circuit breaking capacity Icu and Ics

IEC 60947-2 makes distinction between the rated ultimate short-circuit breaking capacity Icu and the rated service short-circuit breaking capacity Ics :


- Rated ultimate short-circuit breaking capacity Icu

Icu is the maximum breaking capacity of a circuit breaker at an associated rated operational voltage and under specified conditions. Icu is expressed in kA and must be at least as large as the prospective short-circuit current at the site of installation.

Circuit breakers that have switched-off at the level of the ultimate short-circuit breaking capacity, are reduced serviceable afterwards and should at least be checked regarding functionality. There may be changes in the overload trip characteristic and increased temperature rise due to the erosion of contact material.


- Rated service short-circuit interrupting capacity Ics

Ics values are usually lower than the values for Icu. Circuit breakers that have been switching-off at the level of the service short-circuit breaking capacity continue to be serviceable afterward.

In plants in which interruptions to operations must be kept as short as possible, product selection should be carried-out based on Ics.


- Breaking capacity of fuses

The same applies to fuses as to circuit breakers with respect to the Icu: at the given rated operational voltage, the rated breaking capacity must be at least as large as the prospective short-circuit current at the site of installation.

Resource: Low-Voltage Switchgear and Controlgear – Allen-Bradley


Diverting the River Flow With Dam

$
0
0
Diverting the River Flow With Dam

Diverting the River Flow With Dam (on photo: High water on the Kootenay River Brilliant Dam; by arrowlakelass @ Flickr)

Content

  1. Homogeneous dams
  2. Zoned embankment dams
  3. Embankments dams with membrane
  • Concrete Dams
    1. Gravity dams
    2. Buttress dams
    3. Arch and Cupola dams
  • Other Dam types
  • Missouri River Dam in South Dakota (VIDEO)
  • Introduction to Dams

    Dams and weirs are primarily intended to divert the river flow into the water conveyance system leading to the powerhouse. Dams also produce additional head and provide storage capacity. We’ll talk about dams and its types in this technical article.

    The choice of dam type depends largely on local topographical and geotechnical conditions.

    For instance if sound rock is not available within reasonable excavation depth, rigid structures such, as concrete dams are difficult. Conversely, for narrow valleys, it can be difficult to find space for separate spillways, and concrete dams can be the natural choice with their inherent possibilities to integrate spillways etc in the dam body.

    In the Nordic countries the ice age has left us with wide and open valleys and moraine material in abundance. Not surprisingly the vast majority of dams are embankment dams with a central core of moraine.

    South of the Alps natural clays suitable for dam core are not in abundance and the topography in many locations favour concrete dams.

    According to the ICOLD (International Committee of Large Dams), a dam is considered “small” when its height, measured from its foundation level to the crest, does not exceed 15 m, the crest length is less than 500 m and the stored water is less than 1 million cubic meters.

    These parameters can be important, because of the complicated administrative procedures often associated with the construction of large dams.

    Go to Content ↑


    Dam Characteristics

    World wide, embankment dams are the more common partly due to the following characteristics, which they possess:

    • Can be adapted to a wide range of foundation conditions.
    • Construction uses natural materials, which can often be found locally, limiting needs for long transportation.
    • The construction process can be continuous and highly mechanized.
    • The design is extremely flexible in accommodating different fill materials.

    Disadvantages with embankment dams are that they are sensitive to overtopping and leakage, and erosion in the dam body and its foundation.

    There is a higher mortality rate among embankment dams as compared to concrete dams.

    Concrete dams on the other hand have drawbacks that correspond to the pros of the embankment dams:

    1. Require certain conditions withrespect to the foundations.
    2. Require processing of natural materials for aggregate at the site, hauling of large quantities of cement and has a labour intensive and discontinuous construction process, leading to large unit costs.

    On the other hand concrete dams have several advantages:
    1. They are suitable for most ranges of topography that is for wide and narrow valleys, provided that foundation conditions are right.
    2. They are not very sensitive to over topping.
    3. A spillway can be placed at the crest, and if required over the entire length of the dam.
    4. Chambers or galleries for drainage, tubing and ancillary works can readily be housed within the dam body.
    5. Powerhouses can be placed right at the top of the dam.


    The development of the Concrete Faced RockfillDam (CFRD) neutralizes many of the drawbacks with core-type embankments. In particular, sensitivity to leakage and erosion is reduced, and dependence of good core material is removed.

    The development of the Roller Compacted Concrete Dams (RCC-dams) introduces a continuous, highly mechanised construction process and low unit costs. New large dams are almost always CFRD and RCC designs.

    Go to Content ↑


    1. Embankment Dams

    Homogeneous dams

    These dams are used for low embankments (<4m) and often as secondary dams. For dam safety reasons, some type of drainage is almost always provided.

    Go to Content ↑


    Zoned embankment dams

    These are used for dam heights from 4m and up. Constructions are extremely sensitive to the engineering design and construction, and it is therefore vital to engage highly skilled consultants and contractors require experienced site-supervision engineers.

    Critical components of these dams are the core, the transition zones (filters) surrounding the core and drainage capacity of the dam toe (see figure 1).

    Go to Content ↑


    Embankments dams with membrane

    The membranes can be of different types and be located either at the upstream front of the embankment or vertically in the centre of the embankment.

    Membranes can be made from concrete (as in the CFRD), asphalt (Norwegian type) or in the form of a geomembrane on the upstream slope.

    A zoned embankmentdam with moraine core

    Figure 1 - A zoned embankmentdam with moraine core


    Embankment dams are often categorised according to the main fill material, for example, rock-fill dams, or earth-fill dams.

    Go to Content ↑


    2. Concrete Dams

    Generally, concrete dams are categorized according to how they function statically, and fall into one of the following groups.


    Gravity dams

    These are dependent on their own mass for stability. Their cross-section is basically triangular in order to provide adequate stability and stress distribution across the foundation plane.

    The upper part is normally rectangular in order to provide adequate crest width for installation and transportation.

    Design issues include stability analysis (sliding and overturning), stress control, temperature control during construction to avoid cracking, control of uplift pressures under the dam, etc. In photo 1 a gravity dam constructed of RCC (left photo) is shown. Note the characteristic stepped downstream slope.

    Go to Content ↑


    Buttress dams

    These dams consist of a continuous upstream face that is supported by buttresses at regular intervals.

    The upstream face is normally divided into vertical sections by dilatation joints, each section being supported by a buttress.

    Cross-sections are similar to those of gravitation dams. In colder climates, the upstream face can be susceptible to freezing of the water contained in the concrete, damaging the concrete. For this reason buttress dams in such locations are often covered along the downstream contour of the buttresses in order to provide climate control.

    The right-hand photo in photo 1 shows an example of a buttress dam. Note that the spillway is also a buttress type structure.

    Examples of gravity (RCC) and buttress dams

    Photo 1 - Examples of gravity (RCC) and buttress dams


    Go to Content ↑


    Arch and Cupola dams

    These dams function structurally as horizontally laid out arches that transfer the water pressure on the upstream face into the abutments rather than into the foundation.

    Arch dams can be designed with a constant radius over the dam height, or with varying radii (Cupola dams). Arch dams with a constant radius have a vertical and “straight” cross-section.

    These dams will be subject to considerable vertical strainforces since the deformation of the dam will tend to be greatest in the vertical centre of the dam. This requires that the dam be heavily reinforced to avoid cracking with accompanying leakage.

    The Cupola dam is designed to have only compression forces for all directions and at all sections. This requires the radius of the curvature to vary over the dam height, which produces a curved vertical cross-section.

    The arch and cupola dams are structurally efficient and greatly reduce the required volume of concrete.

    They require, however, a narrow valley topography and strong foundation rock in the abutments. In photo 2 an example of an arch dam is shown, and in figure 2 the typical geometry for single curvature arch dams versus double curvature cupola dams is displayed.

    Example of an arch dam

    Photo 2 - Example of an arch dam


    Typical geometry for arch and cupola dams

    Figure 2 - Typical geometry for arch and cupola dams (single curvature arch dam to the left)


    Go to Content ↑


    3. Other Dam types

    Another type of concrete dam is the spillway dam, which can be gated or ungated.

    A gated dam with large spillway openings compared to the dam height is often designed to function as a buttress dam, whereas higher spillway dams with relatively small spillway openings normally are designed to function as a gravity dam.

    An ungated spillway dam is often referred to as a weir for lower dam heights.

    An old dam type still prevailing is the masonry dam. This dam was prevalent during the early days of industrialization, utilizing the building techniques present at that time.

    The masonry structure functioned as the load bearing structure and water tightness was provided by either vertical timber sheeting on the upstream face or by filling impervious soils upstream of the masonry structure.

    Go to Content ↑


    Missouri River Dam in South Dakota (VIDEO)

    Cant see this video? Click here to watch it on Youtube.

    Go to Content ↑

    Resource: Guide on How to Develop a Small Hydropower Plant (European Small Hydropower Association – ESHA)

    Inspection and Test Procedures for Metal-Enclosed Busways

    $
    0
    0
    Inspection and Test Procedures for Metal-Enclosed Busways

    Inspection and Test Procedures for Metal-Enclosed Busways

    Content

    1. Visual and Mechanical Inspection
    2. Electrical Tests
    3. Test Values
      1. Test Values – Visual and Mechanical
      2. Test Values – Electrical
    4. Tables:
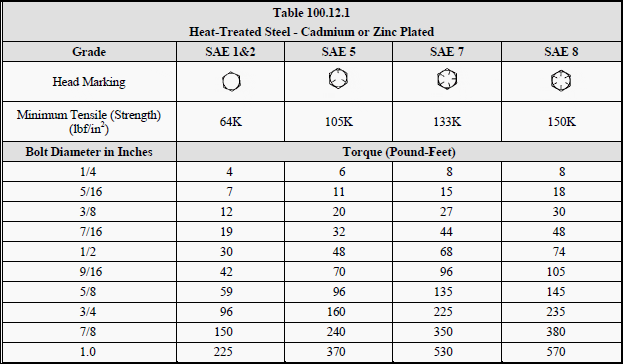
      1. TABLE 100.12 – US Standard Fasteners Bolt-Torque Values for Electrical Connections
      2. TABLE 100.1 – Insulation Resistance Test Values Electrical Apparatus and Systems
      3. TABLE 100.17 – Dielectric Withstand Test Voltages for Metal-Enclosed Bus

    1. Visual and Mechanical Inspection

    1. Compare equipment nameplate datawith drawings and specifications.

    2. Inspect physical and mechanical condition of busway system

    3. Inspect anchorage, alignment, and grounding.

    4. Verify correct connection in accordance with single-line diagram.

    5. Inspect bolted electrical connections for high resistance using one or more of the following methods:

    • Use of a low-resistance ohmmeter in accordance with Section 2 (Electrical Tests).
    • Verify tightness of accessible bolted electrical connections and bus joints by calibrated torque-wrench method in accordance with manufacturer’s published data or Table 100.12 below.
    • Perform thermographic survey
      (NOTE: Remove all necessary covers prior to thermographic inspection. Use appropriate caution, safety devices, and personal protective equipment.)

    6. Confirm physical orientation in accordance with manufacturer’s labels to insure adequate cooling.

    7. Examine outdoor busway for removal of “weep-hole” plugs, if applicable, and the correct installation of joint shield.

    Go to Content ↑


    2. Electrical Tests

    1. Perform resistance measurements through bolted connections and busjoints with a low-resistance ohmmeter, if applicable, in accordance with Section 1 (Visual and Mechanical Inspection).

    2. Measure insulation resistance of each busway, phase-to-phase and phase-to-ground for one minute, in accordance with Table 100.1 below.

    3. Perform a dielectric withstand voltage test on each busway, phase-to-ground with phases not under test grounded, in accordance with manufacturer’s published data. In the absence of manufacturer’s published data, use Table 100.17.

    Where no dc test value is shown in Table 100.17, ac value shall be used. The test voltage shall be applied for one minute.

    4. Perform a contact-resistance test on each connection point of uninsulated busway. On insulated busway, measure resistance of assembled busway sections and compare values with adjacent phases.

    5. Perform phasing test on each busway tie section energized by separate sources. Tests must be performed from their permanent sources.

    6. Verify operation of busway space heaters.

    Go to Content ↑


    3. Test Values

    3.1 Test Values – Visual and Mechanical

    1. Compare bolted connection resistance values to values of similar connections. Investigate values which deviate from those of similar bolted connections by more than 50 percent of the lowest value. (7.4.1.5.1)

    2. Bolt-torque levels should be in accordance withmanufacturer’s published data. In the absence of manufacturer’s published data, use Table 100.12. (7.4.1.5.2)

    3. Results of the thermographic survey shall be in accordance with Section 9. (7.4.1.5.3)

    Go to Content ↑


    3.2 Test Values – Electrical

    1. Compare bolted connection resistance values to values of similar connections. Investigate values which deviate from those of similar bolted connections by more than 50 percent of the lowest value.

    2. Insulation-resistance test voltages and resistance values shall be in accordance with manufacturer’s published. In the absence of manufacturer’spublished data, use Table 100.1.

    Minimum resistance values are for a nominal 1000-foot busway run. Use the following formula to convert the measured resistance value to the 1000-foot nominal value:

    Busway run - minimum resistance formula

    Converted values of insulation resistance less than those in Table 100.1 or manufacturer’s minimum should be investigated. Dielectric withstand voltage tests shall not proceed until insulation-resistance levels are raised above minimum values.

    3. If no evidence of distress or insulation failure is observed by the end of the total time of voltage application during the dielectric withstand test, the test specimen is considered to have passed the test.

    4. Microhm or dc millivolt drop values shall not exceed the high levels of the normal range as indicated in the manufacturer’s published data.

    If manufacturer’s published data is not available, investigate values which deviate from those of similar bus connections and sections by more than 50 percent of the lowest value.

    5. Phasing test results shall indicate the phase relationships are in accordance with system design.

    6. Heaters shall be operational.

    Go to Content ↑


    TABLE 100.12

    US Standard Fasteners – Bolt-Torque Values for Electrical Connections

    Table 100.12.1 - Heat-Treated Steel - Cadmium or Zinc Plated

    Table 100.12.1 - Heat-Treated Steel - Cadmium or Zinc Plated


    Table 100.12.2 - Silicon Bronze Fasteners

    Table 100.12.2 - Silicon Bronze Fasteners


    Table 100.12.3 - Aluminum Alloy Fasteners

    Table 100.12.3 - Aluminum Alloy Fasteners


    Table 100.12.4 - Stainless Steel Fasteners

    Table 100.12.4 - Stainless Steel Fasteners


    a. Consult manufacturer for equipment supplied with metric fasteners.
    b. This table is based on bronze alloy bolts having a minimum tensile strength of 70,000 pounds per square inch.
    c. This table is based on aluminum alloy bolts having a minimum tensile strength of 55,000 pounds per square inch.
    d. This table is to be used for the following hardware types:

    • Bolts, cap screws, nuts, flat washers, locknuts (18–8 alloy)
    • Belleville washers (302 alloy).

    Go to Content ↑


    TABLE 100.1

    Insulation Resistance Test Values Electrical Apparatus and Systems

    Insulation Resistance Test Values

    Table 100.1 - Insulation Resistance Test Values for Electrical Apparatus and Systems


    Go to Content ↑


    TABLE 100.17

    Dielectric Withstand Test Voltages for Metal-Enclosed Bus

    Dielectric Withstand Test Voltages for Metal-Enclosed Bus

    Table 100.17 - Dielectric Withstand Test Voltages for Metal-Enclosed Bus


    Go to Content ↑

    Resource: Acceptance Testing Specifications for Electrical Power Distribution Equipment and Systems – NETA 2003

    Few Words About Digital Protection Relay

    $
    0
    0
    Few Words About Digital Protection Relay

    Few Words About Digital Protection Relay (on photo: Siprotec microprocessor based protective relay)

    History of Protective Relay

    Around 1980s the digital relay entered the market. Compared to the Solid State Relay, the digital relay takes the advantages of the development of microprocessors and microcontrollers. Instead of using analog signals, the digital relay converts all measured analog quantities into digital signals.

    Digital protection relays is a revolution step in changing Relay technology.

    In Digital Relay Microprocessors and micro controllers are used in replacement of analogue circuits used in static relays to implement relay functions. Digital protection relays introduced in 1980.

    However, such technology will be completely superseded within the next five years by numerical relays.

    By the mid-1990s the solid state and electromechanical relay had been mostly replaced by digital relay in new construction. In distribution applications, the replacement by the digital relay proceeded a bit more slowly.

    While the great majority of feeder relays in new applications today are digital, the solid state relay still sees some use where simplicity of the application allows for simpler relays, and which allows one to avoid the complexity of digital relays.


    Measuring principles

    Compared to static relays, digital relays introduce Analogue to Digital Convertor (A/D conversion) of all measured analogue quantities and use a microprocessor to implement the protection algorithm.

    The microprocessor may use some kind of counting technique, or use the Discrete Fourier Transform (DFT) to implement the algorithm.

    The Microprocessors used in Digital Relay have limited processing capacity and memory compared to that provided in numerical relays.

    Function of Relay

    The functionality tends therefore to be limited and restricted largely to the protection function itself. Additional functionality compared to that provided by an electromechanical or static relay is usually available, typically taking the form of a wider range of settings, and greater accuracy.

    A communications link to a remote computer may also be provided.

    SEPAM relays in medium voltage switchgear

    SEPAM relays in medium voltage switchgear


    The limited power of the microprocessors used in digital relays restricts the number of samples of the waveform that can be measured per cycle. This, in turn, limits the speed of operation of the relay in certain applications. Therefore, a digital relay for a particular protection function may have a longer operation time than the static relay equivalent.

    However, the extra time is not significant in terms of overall tripping time and possible effects of power system stability.


    Operation of Relay

    Digital relay consists of:

    1. Analogue input subsystem,
    2. Digital input subsystem,
    3. Digital output subsystem,
    4. A processor along with RAM (data scratch pad),
    5. main memory (historical data file) and
    6. Power supply
    Operation diagram of digital relay

    Operation diagram of digital relay


    Digital relaying involves digital processing of one or more analog signals in three steps:

    1. Conversion of analogue signal to digital form
    2. Processing of digital form
    3. Boolean decision to trip or not to trip.

     Advantages of Digital Relay

    • High level of functionality integration.
    • Additional monitoring functions.
    • Functional flexibility.
    • Capable of working under a wide range of temperatures.
    • They can implement more complex function and are generally more accurate
    • Self-checking and self-adaptability.
    • Able to communicate with other digital equipment (pear to pear).
    • Less sensitive to temperature, aging
    • Economical because can be produced in volumes
    • More Accurate.
    • plane for distance relaying is possible
    • Signal storage is possible

    Limitations of Digital Relay

    • Short lifetime due to the continuous development of new technologies.
    • The devices become obsolete rapidly.
    • Susceptibility to power system transients.
    • As digital systems become increasingly more complex they require specially trained staff for Operation.
    • Proper maintenance of the settings and monitoring data.

    References

    • Handbook of Switchgear –Bhel
    • Digital/Numerical Relays -T.S.M. Rao

    SCADA As Heart Of Distribution Management System

    $
    0
    0
    SCADA – The Heart Of Distribution Management System (DMS)

    SCADA – The Heart Of Distribution Management System (DMS) - On photo: Fima UAB - Dedicated control systems and SCADA (Supervisory Control and Data Acquisition) as well as DMS (Distribution Management System) type of systems are offered for electricity, water and gas supply companies, as well as telecommunication operators and manufacturing companies.

    SCADA System Elements

    At a high level, the elements of a distribution automation system can be divided into three main areas:

    1. SCADA application and server(s)
    2. DMS applications and server(s)
    3. Trouble management applications and server(s)

    Distribution SCADA

    As was stated in the title, the Supervisory Control And Data Acquisition (SCADA) system is the heart of Distribution Management System (DMS) architecture.

    A SCADA system should have all of the infrastructure elements to support the multifaceted nature of distribution automation and the higher level applications of a DMS. A Distribution SCADA system’s primary function is in support of distribution operations telemetry, alarming, event recording, and remote control of field equipment.

    Historically, SCADA systems have been notorious for their lack of support for the import, and more importantly, the export of power system data values.

    A modern SCADA system should support the engineering budgeting and planning functions by providing access to power system data without having to have possession of an operational workstation.

    The main elements of a SCADA system are:

    1. Host equipment
    2. Communication infrastructure (network and serial communications)
    3. Field devices (in sufficient quantity to support operations and telemetry requirements of a DMS platform)
    DA system architecture

    Figure 1 - DA system architecture

    Host Equipment

    The essential elements of a distribution SCADA host are:

    1. Host servers (redundant servers with backup/failover capability).
    2. Communication front-end nodes (network based).
    3. Full graphics user interfaces.
    4. Relational database server (for archival of historical power system values) and data server/Web server (for access to near real time values and events).

    The elements and components of the typical distribution automation system are illustrated in Figure 1 above.


    Host Computer System

    SCADA Servers

    As SCADA has proven its value in operation during inclement weather conditions, service restoration, and daily operations, the dependency on SCADA has created a requirement for highly available and high performance systems. Redundant server hardware operating in a “live” backup/failover mode is required to meet the high availability criteria.

    High-performance servers with abundant physical memory, RAID hard disk systems, and interconnected by 10/100 baseT switched Ethernet are typical of today’s SCADA servers.

    Communication Front-End (CFE) Processors

    The current state of host to field device communications still depends heavily on serial communications.

    This requirement is filled by the CFE. The CFE can come in several forms based on bus architecture (e.g., VME or PCI) and operating system. Location of the CFE in relation to the SCADA server can vary based on requirement. In some configurations the CFE is located on the LAN with the SCADA server. In other cases, existing communications hubs may dictate that the CFE reside at the communication hub.

    The incorporation of the WAN into the architecture requires a more robust CFE application to compensate for less reliable communications (in comparison to LAN).

    In general the CFE will include three functional devices:

    1. A network/CPU board,
    2. Serial cards, and
    3. Possibly a time code receiver.

    Functionality should include the ability to download configuration and scan tables. The CFE should also support the ability to dead band values (i.e., report only those analog values that have changed by a user-defined amount).

    CFE, network, and SCADA servers should be capable of supporting worst-case conditions (i.e., all points changing outside of the dead band limits), which typically occur during severe system disturbances.


    Full Graphics User Interface

    The current trend in the user interface (UI) is toward a full graphics (FG) user interface. While character graphics consoles are still in use by many utilities today, SCADA vendors are aggressively moving their platforms to a full graphics UI.

    Quite often the SCADA vendors have implemented their new full graphics user interface on low-cost NT workstations using third-party applications to emulate the X11 window system.

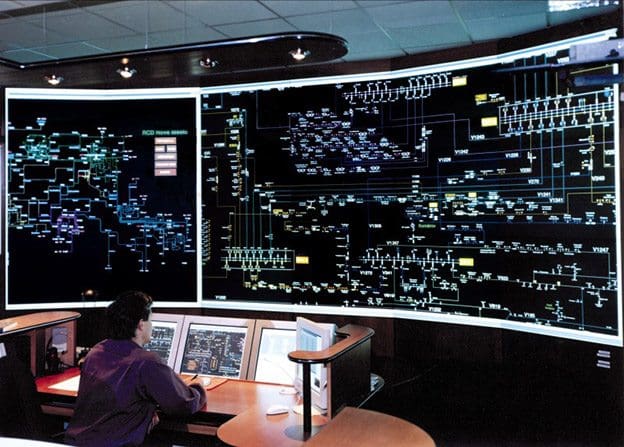
    SCADA - Full graphic display using Video Wall

    SCADA - Full graphic display using Video Wall


    Full graphic displays provide the ability to display power system data along with the electric distribution facilities in a geographical (or semigeographical) perspective.

    The advantage of using a full graphics interface becomes evident (particularly for distribution utilities) as SCADA is deployed beyond the substation fence where feeder diagrams become critical to distribution operations.


    Relational Databases, Data Servers, and Web Servers

    The traditional SCADA systems were poor providers of data to anyone not connected to the SCADA system by an operational console.

    This occurred due to the proprietary nature of the performance (in memory) database and its design optimization for putting scanned data in and pushing display values out. Power system quantities such as: bank and feeder loading (MW, MWH, MQH, and ampere loading), and bus volts provide valuable information to the distribution planning engineer.

    The availability of event (log) data is important in postmortem analysis. The use of relational databases, data servers, and Web servers by the corporate and engineering functions provides access to power system information and data while isolating the SCADA server from nonoperations personnel.

    Host to Field Communications

    Serial communications to field devices can occur over several mediums: copper wire, fiber, radio, and even satellite. Telephone circuits, fiber, and satellites have a relatively high cost. New radio technologies offer good communications value.

    One such technology is the Multiple Address Radio System (MAS).

    The MAS operates in the 900 MHz range and is omnidirectional, providing radio coverage in an area with radius up to 20–25 miles depending on terrain. A single MAS master radio can communicate with many remote sites. Protocol and bandwidth limit the number of remote terminal units that can be communicated with by a master radio. The protocol limit is simply the address range supported by the protocol.

    Bandwidth limitations can be offset by the use of efficient protocols, or slowing down the scan rate to include more remote units. Spread-spectrum and point-to-point radio (in combination with MAS) offers an opportunity to address specific communication problems.

    At the present time MAS radio is preferred to packet radio (another new radio technology); MAS radio communications tend to be more deterministic providing for smaller timeout values on communication noresponses and controls.


    Field Devices

    Distribution Automation (DA) field devices are multi-featured installations meeting a broad range of control, operations, planning, and system performance issues for the utility personnel.

    Each device provides specific functionality, supports system operations, includes fault detection, captures planning data and records power quality information. These devices are found in the distribution substation and at selected locations along the distribution line. The multi-featured capability of the DA device increases its ability to be integrated into the electric distribution system.

    The functionality and operations capabilities complement each other with regard to the control and operation of the electric distribution system.

    The fault detection feature is the “eyes and ears” for the operating personnel. The fault detection capability becomes increasingly more useful with the penetration of DA devices on the distribution line.

    The real-time data collected by the SCADA system is provided to the planning engineers for inclusion in the radial distribution line studies. As the distribution system continues to grow, the utility makes annual investments to improve the electric distribution system to maintain adequate facilities to meet the increasing load requirements.

    The use of the real-time data permits the planning engineers to optimize the annual capital expenditures required to meet the growing needs of the electric distribution system.

    The power quality information includes capturing harmonic content to the 15th harmonic and recording Percent Total Harmonic Distortion (%THD). This information is used to monitor the performance of the distribution electric system.


    Modern RTU

    Today’s modern RTU is modular in construction with advanced capabilities to support functions that heretofore were not included in the RTU design.

    The modular design supports installation configurations ranging from the small point count required for the distribution line pole-mounted units to the very large point count required for large bulk-power substations and power plant switchyard installations.

    Modern RTU Scada

    Modern RTU Scada


    The modern RTU modules include analog units with 9 points, control units with 4 control pair points, status units with 16 points, and communication units with power supply.

    The RTU installation requirements are met by accumulating the necessary number of modern RTU modules to support the analog, control, status, and communication requirements for the site to be automated. Packaging of the minimum point count RTUs is available for the distribution line requirement.

    The substation automation requirement has the option of installing the traditional RTU in one cabinet with connections to the substation devices or distributing the RTU modules at the devices within the substation with fiberoptic communications between the modules.

    The distributed RTU modules are connected to a data concentrating unit which in turn communicates with the host SCADA computer system.

    The modern RTU accepts direct AC inputs from a variety of measurement devices including line-post sensors, current transformers, potential transformers, station service transformers, and transducers. Direct AC inputs with the processing capability in the modern RTU supports fault current detection and harmonic content measurements. The modern RTU has the capability to report the magnitude, direction, and duration of fault current with time tagging of the fault event to 1-millisecond resolution. Monitoring and reporting of harmonic content in the distribution electric circuit are capabilities that are included in the modern RTU.

    The digital signal processing capability of the modern RTU supports the necessary calculations to report %THD for each voltage and current measurement at the automated distribution line or substation site.

    The modern RTU includes logic capability to support the creation of algorithms to meet specific operating needs.

    Automatic transfer schemes have been built using automated switches and modern RTUs with the logic capability. This capability provides another option to the distribution line engineer when developing the method of service and addressing critical load concerns.

    The logic capability in the modern RTU has been used to create the algorithm to control distribution line switched capacitors for operation on a per phase basis. The capacitors are switched on at zero voltage crossing and switched off at zero current crossing.

    The algorithm can be designed to switch the capacitors for various system parameters, such as voltage, reactive load, time, etc. The remote control capability of the modern RTU then allows the system operator to take control of the capacitors to meet system reactive load needs.

    The modern RTU has become a dynamic device with increased capabilities. The new logic and input capabilities are being exploited to expand the uses and applications of the modern RTU.


    PLCs and IEDs

    Programmable Logic Controller (PLC) and Intelligent Electronic Device (IED) are components of the distribution automation system, which meet specific operating and data gathering requirements.

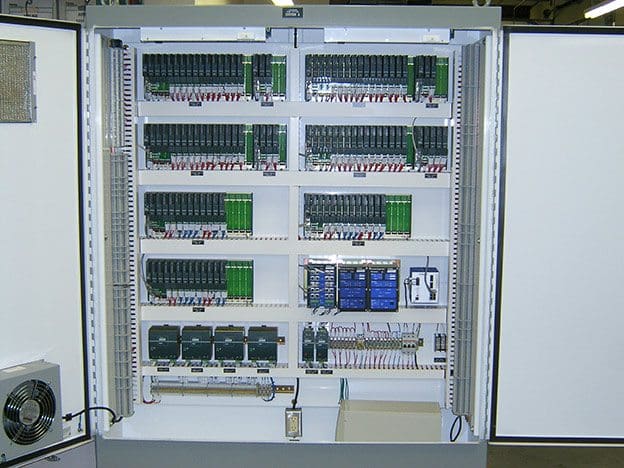
    PLC SCADA Panel

    PLC SCADA Panel


    While there is some overlap in capability with the modern RTU, the authors are familiar with the use of PLCs for automatic isolation of the faulted power transformer in a two-bank substation and automatic transfer of load to the unfaulted power transformer to maintain an increased degree of reliability.

    The PLC communicates with the modern RTU in the substation to facilitate the remote operation of the substation facility.

    The typical PLC can support serial communications to a SCADA server. The modern RTU has the capability to communicate via an RS-232 interface with the PLC.

    IEDs include electronic meters, electronic relays, and controls on specific substation equipment, such as breakers, regulators, LTC on power transformers, etc.

    The IEDs also have the capability to support serial communications to a SCADA server. However, the authors’ experience indicates that the IEDs are typically reporting to the modern RTU via an RS-232 interface or via status output contact points.

    As its communicating capability improves and achieves equal status with the functionality capability, the IED has the potential to become an equal player in the automation communication environment.

    However, in the opinion of the authors, the limited processing capability for supporting the communication requirement, in addition to its functional requirements (i.e., relays, meters, etc.), hampers the widespread use of the IEDs in the distribution automation system.

    Resource: Power System Operation and Control - George L. Clark and Simon W. Bowen
    7 Golden Safety Rules for Working In HV Laboratory

    $
    0
    0
    7 Golden Safety Rules for Working In HV Laboratory

    7 Golden Safety Rules for Working In HV Laboratory (on photo: High-Voltage Lab, Delft University of Technology, Delft, Netherlands)

    Employees performing operations and testing work in high voltage laboratory are exposed to a greater hazard than most other employees.

    Safety rules MUST NOT be seen as a means of limiting our freedom, but should rather be looked upon as valuable advice to ensure safe working conditions.

    7 golden rules to remember ALWAYS

    Just to mention that there are many other safety rules to be followed. These are just the basics and I think some of the most important.

    If you have some rule(s) to add, please leave the comment below ;)


    Rule no. 1

    Sufficient clearances must be provided to prevent unplanned flashovers.


    Rule no. 2

    Suitable barriers must be provided.


    Rule no. 3

    A suitable earth plane must be provided as safety earth and reference point for measurements. It is not advisable to try to separate earths. In measuring circuits, such as voltage dividers and the Schering bridge, a bolted connection to earth is required.

    If this connection is broken, the full voltage appears across the break. Protective spark gaps and overvoltage limiting devices can be used.


    Rule no. 4

    Any object in the laboratory should be either well connected to earth potential or at high voltage. “Floating” objects cause problems.


    Rule no. 5

    Suitable interlocks that switch off the power on opening must be provided on doors and gates leading to live areas.


    Rule no. 6

    A suitable earth stick must be provided to earth any piece of equipment before touching. The rule is not to become part of a circuit. Special care should be taken with circuits having capacitors – especially with DC.


    Rule no. 7

    A person must NEVER work alone in a high voltage laboratory: double check and cross-check.


    Engineering High Voltage Lab – University of Leicester (VIDEO)

    Cant see this video? Click here to watch it on Youtube.

    Flexibility and Reliability of Numerical Protection Relay

    $
    0
    0
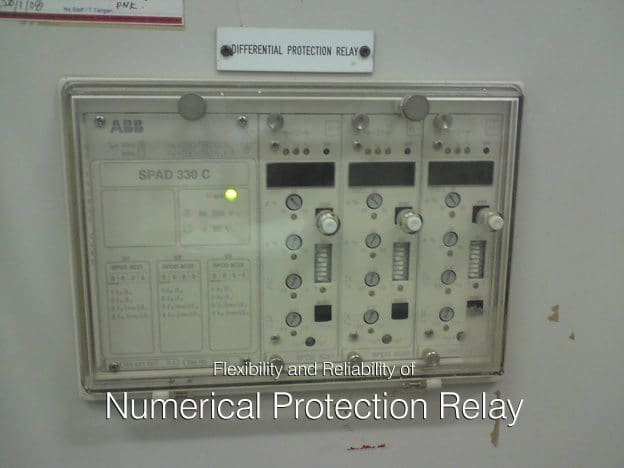
    Flexibility and Reliability of Numerical Protection Relay

    Flexibility and Reliability of Numerical Protection Relay (on photo: ABB's numerical relay type SPAD 330 C designed to be used as a fast interwinding short-circuit and interturn fault protection for two-winding power transformers and power plant generator-transformer units.

    History of Relay

    The first protection devices based on microprocessors were employed in 1985. The widespread acceptance of numerical technology by the customer and the experiences of the user helped in developing the second generation numerical relays in 1990.

    Conventional electromechanical and static relays are hard wired relays. Their wiring is fixed, only their setting can be manually changed. Numeric relays are programmable relays. The characteristics and behaviour of the relay are can be programmed.

    First generation numerical relays were mainly designed to meet the static relay protection characteristic, whereas modern numeric protection devices are capable of providing complete protection with added functions like control and monitoring.

    Numerical protection devices offer several advantages in terms of protection, reliability, troubleshooting and fault information.

    The distinction between digital relay and numerical relay rests on points of fine technical detail, and is rarely found in areas other than Protection. They can be viewed as natural developments of digital relays as a result of advances in technology.

    Typically, they use a specialized digital signal processor (DSP) as the computational hardware, together with the associated software tools.


    Measuring Principles

    The input analogue signals are converted into a digital representation and processed according to the appropriate mathematical algorithm. Processing is carried out using a specialized microprocessor that is optimized for signal processing applications, known as a digital signal processor or DSP for short. Digital processing of signals in real time requires a very high power microprocessor.

    The measuring principles and techniques of conventional relays (electromechanical and  static) are fewer than those of the numerical technique, which can differ in many aspects like the type of protection algorithm used, sampling, signal processing, hardware selection, software discipline, etc.

    These are microprocessor-based relays in contrast to other relays that are electromechanically controlled.


    Function of Relay

    Numerical Directional Overcurrent Relay

    Numerical Directional Overcurrent Relay (Relay operating time is determined by selecting definite time characteristics or one of the four inverse time characteristics i.e. 3s normal inverse, 1.3s normal inverse, very inverse and extremely inverse.)

    Modern power system protection devices are built with integrated functions. Multifunction like protection, control, monitoring and measuring are available today in numeric power system protection devices.

    Also, the communication capability of these devices facilitates remote control, monitoring and data transfer.

    Traditionally, electromechanical and static protection relays offered single-function, single characteristics, whereas modern numeric protection offers multi-function and multiple characteristics. Numerical protection devices offer several advantages in terms of protection, reliability, and trouble shooting and fault information.

    Numerical protection devices are available for generation, transmission and distribution systems.

    Numerical relays are microprocessor based relays and having the features of recording of parameter used as disturbance recorder flexibility of setting & alarms & can be used one relay for all type of protections  of one equipment hence less area is required.

    Wide Range of setting, more accurate, low burden hence low VA of CT is required which minimize the cost.

    Numeric relays take the input analog quantities and convert them to numeric values.  All of the relaying functions are performed on these numeric values.

    The following sections cover:

    1. Relay hardware,
    2. Relay software,
    3. Multiple protection characteristics,
    4. Adaptive protection characteristics,
    5. Data storage,
    6. Instrumentation feature,
    7. Self-check feature,
    8. Communication capability,
    9. Additional functions,
    10. Size and cost-effectiveness.

    The disadvantages of a conventional electromechanical relay are overcome by using microcontroller for realizing the operation of the relays.

    Microcontroller based relays perform very well and their cost is relatively low.


    Operation of Relay

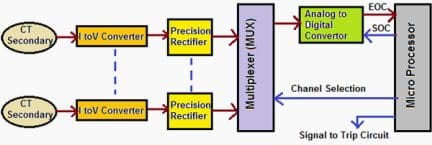
    A current signal from CT is converted into proportional voltage signal using I to V converter.

    The AC voltage proportional to load current is converted into DC using precision rectifier and is given to multiplexer (MUX) which accepts more than one input and gives one output.

    Microprocessor sends command signal to the multiplexer to switch on desired channel to accept rectified voltage proportional to current in a desired circuit.


    Microprocessor Based Numerical Relay

    Microprocessor Relay - Operation diagram

    Microprocessor Relay - Operation diagram


    Output of Multiplexer is fed to analog to digital converter (ADC) to obtain signal in digital form. Microprocessor then sends a signal ADC for start of conversion (SOC), examines whether the conversion is completed and on receipt of end of conversion (EOC) from ADC, receives the data in digital form.

    The microprocessor then compares the data with pick-up value.

    If the input is greater than pick-up value the microprocessor send a trip signal to circuit breaker of the desired circuit.

    In case of instantaneous overcurrent relay there is no intentional time delay and circuit breaker trips instantly. In case of normal inverse, very inverse, extremely inverse and long inverse overcurrent relay the inverse current-time characteristics are stored in the memory of microprocessor in tabular form called as look-up table.


     Advantages of Numerical relays

    Compact Size

    Electromechanical Relay makes use of mechanical comparison devices, which cause the main reason for the bulky size of relays. It uses a flag system for the indication purpose whether the relay has been activated or not.

    While numerical relay is in compact size and use indication on LCD for relay activation.

    Digital protection can be physically smaller, and almost always requires less panel wiring than equivalent functions implemented using analog technology.

    Flexibility

    A variety of protection functions can be accomplished with suitable modifications in the software only either with the same hardware or with slight modifications in the hardware.


    Reliability

    A significant improvement in the relay reliability is obtained because the use of fewer components results in less interconnections and reduced component failures.


    Multi Function Capability

    Traditional electromechanical and static protection relays offers single-function and single characteristics. Range of operation of electromechanical relays is narrow as compared to numerical relay.


    Different types of relay characteristics

    It is possible to provide better matching of protection characteristics since these characteristics are stored in the memory of the microprocessor.


    Digital communication capabilities

    The microprocessor based relay furnishes easy interface with digital communication equipment. Fibre optical communication with substation LAN.


    Modular frame

    The relay hardware consists of standard modules resulting in ease of service.


    Low burden

    The microprocessor based relays have minimum burden on the instrument transformers.


    Sensitivity

    Greater sensitivity and high pickup ratio.


    Speed

    With static relays, tripping time of ½ cycle or even less can be obtained.


    Fast Resetting

    Resetting is less.


    Data History

    Availability of fault data and disturbance record. Helps analysis of faults by recording details of:

    1. Nature of fault,
    2. Magnitude of fault level,
    3. Breaker problem,
    4. C.T. saturation,
    5. Duration of fault.

    Auto Resetting and Self Diagnosis

    Electromechanical relay do not have the ability to detect whether the normal condition has been attained once it is activated thus auto resetting is not possible and it has to be done by the operating personnel, while in numerical relay auto resetting is possible.

    Other Advantages

    • By combining several functions in one case, numerical relays also save capital cost and maintenance cost over electromechanical relays
    • Separate connection is not required, zero sequence voltages and currents can be derived inside the processor
    • Basic hardware is shared between multiple functions, the cost of individual protection functions can be reduced significantly.
    • Loss of voltage feature helps block the relay in case of momentary/permanent loss of voltage.

    Limitations of Numerical Relay

    Protection quality

    Numerical relay offers more functionality, and greater precision. Unfortunately, that does not necessarily translate into better protection.


    Faster Decisions

    Numerical Relay can make faster decisions. However, in the real world, faster protection itself is of no value because circuit breakers are still required to interrupt at the direction of the protective equipment, and the ability to make circuit breakers interrupt faster is very limited.


    Risk Of Hacking

    Numerical Relay protection often relies on non-proprietary software, exposing the system to potential risk of hacking.


    Interference

    Numerical Relay protection sometimes has exposure to externally-sourced transient interference that would not affect conventional technology.


    Failure Impact

    Numerical Relay protection shares common functions. This means that there are common failure modes that can affect multiple elements of protection.

    For example, failure of a power supply or an input signal processor may disable an entire protective device that provides many different protection functions.

    This problem has receive a lot of design attention, and experience generally has supported the notion that the equipment has a very high reliability once it is past the infant mortality stage.

    But it remains something to be aware of.


    Functions

    A multifunction numeric relay can provide three phase, ground, and negative sequence directional or non-directional overcurrent protection with four shot recloser, forward or reverse power protection, breaker failure, over/under frequency, and over/under voltage protection, sync check, breaker monitoring and control.

    It would take 10 – 11 single function Solid state or electromechanical relays at least 5 to 6 times the cost.

    Additionally Numeric relays have communications capabilities, sequence-of-events recording, fault reporting, rate-of-change frequency, and metering functions, all in an integrated system.

    Importance of Transformer Inrush Current

    $
    0
    0
    Importance of Transformer Inrush Current

    Importance of Transformer Inrush Current (on photo: Data Center Power Transformer by digitalrealtytrust @ Flickr)

    Residual Flux

    When a transformer is taken off-line, there will be a certain amount of residual flux that can remain in the core due to the properties of the magnetic core material.

    The residual flux can be as much as 50 to 90% of the maximum operating flux, depending on the type of core steel. When voltage is reapplied to the transformer, the flux introduced by this source voltage will build upon that which already exists in the core.

    In order to maintain this level of flux in the core, which can be well into the saturation range of the core steel, the transformer can draw current well in excess of the transformer’s rated full load current.

    Depending on the transformer design, the magnitude of this current inrush can be anywhere from 3.5 to 40 times the rated full load current. The waveform of the inrush current will be similar to a sine wave, but largely skewed towards the positive or negative direction. This inrush current will experience a decay, partially due to transformer losses, which will provide a dampening effect; however, the current can remain well above rated current for many cycles.

    This inrush current can have an effect on the operation of relays and fuses located in the system near the transformer.

    Decent approximations of the inrush current require detailed information regarding the transformer design which may be available from the manufacturer but is not typically available to the user.

    Actual inrush currents will also depend upon where in the source voltage wave the switching operations occur, the moment of opening effecting the residual flux magnitude, and the moment of closing effecting the new flux.

    Resource: James H. Harlow – Harlow Engineering Associates


    PLC Application For Speed Control of AC Motors With Variable Speed (VS) Drive

    $
    0
    0
    PLC Application For Speed Control of AC Motors With VSD

    PLC Application For Speed Control of AC Motors With VSD (on photo: Quadplex panel that controls four total pumps, two 25HP and two 50HP pumps controlled by corresponding variable frequency drives with filters. The 460V 3PH 4 wire 300A panel features a PLC based control system with back up floats and intrinisically safe barriers for level sensors. by D&B Custom Wiring)

    AC Motor Drive Interface

    A common PLC application is the speed control of AC motors with variable speed (VS) drives. The diagram in Figure 1 shows an operator station used to manually control a VS drive.

    The programmable controller implementation of this station will provide automatic motor speed control through an analog interface by varying the analog output voltage (0 to 10 VDC) to the drive.

    The operator station consists of:

    1. a speed potentiometer (speed regulator),
    2. a forward/reverse direction selector,
    3. a run/jog switch, and
    4. start and stop push buttons.

    The PLC program will contain all of these inputs except the potentiometer, which will be replaced by an analog output.

    The required input field devices (i.e., start push button, stop push button, jog/run, and forward/ reverse) will be added to the application and connected to input modules, rather than using the operator station’s components.

    The PLC program will contain the logic to start, stop, and interlock the forward/reverse commands.
    Operator station for a variable speed drive

    Figure 1 - Operator station for a variable speed drive


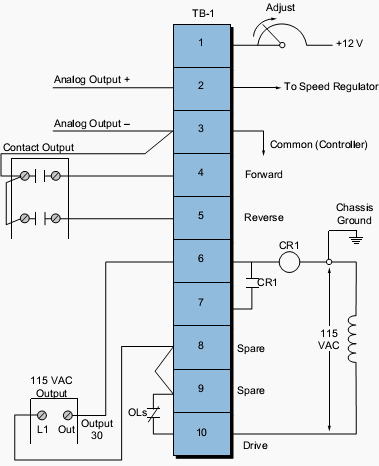
    Table 1 shows the I/O address assignment table for this example, while Figure 2 illustrates the connection diagram from the PLC to the VS drive’s terminal block (TB-1). The connection uses a contact output interface to switch the forward/reverse signal, since the common must be switched.

    To activate the drive, terminal TB-1-6 must receive 115 VAC to turn ON the internal relay CR1. The drive terminal block TB-1-8 supplies power to the PLC’s L1 connection to turn the drive ON. The output of the module (CR1) is connected to terminal TB-1-6. The drive’s 115 VAC signal is used to control the motor speed so that the signal is in the same circuit as the drive, avoiding the possibility of having different commons (L2) in the drive (the start/stop common is not the same as the controller’s common).

    In this configuration, the motor’s overload contacts are wired to terminals TB-1-9 and TB-1-10, which are the drive’s power (L1) connection and the output interface’s L1 connection. If an overload occurs, the drive will turn OFF because the drive’s CR1 contact will not receive power from the output module.

    This configuration, however, does not provide low-voltage protection, since the drive and motor will start immediately after the overloads cool off and reclose.

    To have low-voltage protection, the auxiliary contact from the drive, CR1 in terminal TB-1-7, must be used as an input in the PLC, so that it seals the start/stop circuit.


    I/O address assignment

    Table 1 - I/O address assignment


    Connection diagram from the PLC to the VS drive’s terminal block.

    Figure 2 - Connection diagram from the PLC to the VS drive’s terminal block.

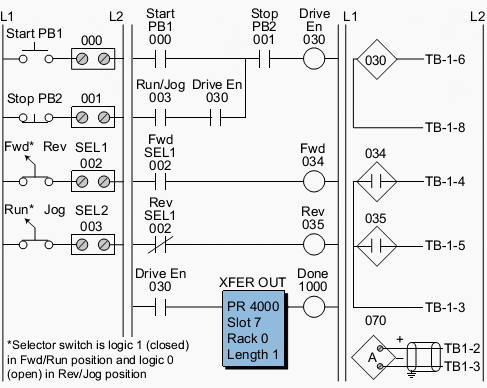
    Figure 3 shows the PLC ladder program that will replace the manual operator station. The forward and reverse inputs are interlocked, so only one of them can be ON at any given time (i.e., they are mutually exclusive).

    If the jog setting is selected, the motor will run at the speed set by the analog output when the start push button is depressed. The analog output connection simply allows the output to be enabled when the drive starts. Register 4000 holds the value in counts for the analog output to the drive. Internal 1000, which is used in the block transfer, indicates the completion of the instruction.

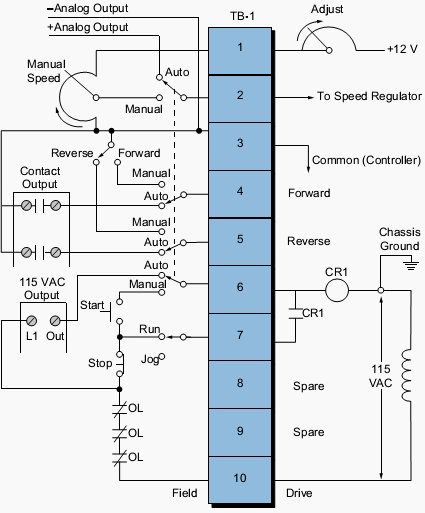
    Sometimes, a VS drive requires the ability to run under automatic or manual control (AUTO/MAN). Several additional hardwired connections must be made to implement this dual control.


    PLC implementation of the VS drive

    Figure 3 - PLC implementation of the VS drive


    The simplest and least expensive way to do this is with a selector switch (e.g., a four-pole, single-throw, single-break selector switch). With this switch, the user can select either the automatic or manual option. Figure 4 illustrates this connection.

    Note that the start, stop, run/jog, potentiometer, and forward/reverse field devices shown are from the operator station. These devices are connected to the PLC interface under the same names that are used in the control program (refer to Figure 3).

    If the AUTO/MAN switch is set to automatic, the PLC will control the drive; if the switch is set to manual, the manual station will control the drive.

    VS drive with AUTO/MAN capability

    Figure 4 - VS drive with AUTO/MAN capability


    Resource: Introduction-to-PLC-Programming – www.globalautomation.info

    Lighting Circuits Connections for Interior Electrical Installations (2)

    $
    0
    0
    Light switch for interior installation

    Light switch for interior installation


    Continued from first part: Lighting Circuits Connections for Interior Electrical Installations


    Introduction

    In modern internal electrical installations, domestic and professional, there is a need for lighting installations in staircases and installation of emergency lighting that will operate in the event of interruption of electricity supply from the grid.

    The automatic staircase timer abolished Aller – Retour switches to control the lighting of the staircase.

    Of course, they can also be used as timers in other lighting and automation circuits (second consumption delay, e.g. bathroom ventilator, disengaging switch with a time delay).

    Sometimes, a power failure might occur, due to a fault in the distribution network or due to maintenance issues. In some places such as hospitals, police and fire departments, cinemas and theatres, major hotels and conference rooms, this power outage has unpleasant results.

    In order to address this problem, apart from the main lightning, we also manufacture an emergency lighting system which will be decribed in 3rd part of this technical article.


    Automatic staircase timers

    Single line diagrams, Analytical and Operating diagrams:

    1. Lighting circuit controlled by an automatic staircase timer (based on mercury)
  • Lighting circuit controlled by an automatic staircase timer (electronic)
  • 1. Lighting circuit controlled by an automatic staircase timer (based on mercury)

    Description:

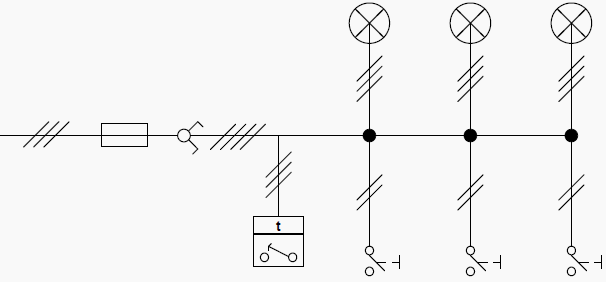
    Lighting circuit of a large number of luminaires, which is controlled by an automatic timer (interruption and restoration), operated by several points (instant contact pushbuttons). The circuit is mainly used in buildings staircases.

    Go up to the Timers ↑


    General diagrams

    Single line diagram

    Lighting circuit controlled by an automatic staircase timer

    Lighting circuit controlled by an automatic staircase timer - Single line diagram


    Important Note: We can connect in the circuit (always in parallel way) several lights and as many buttons as we desire.


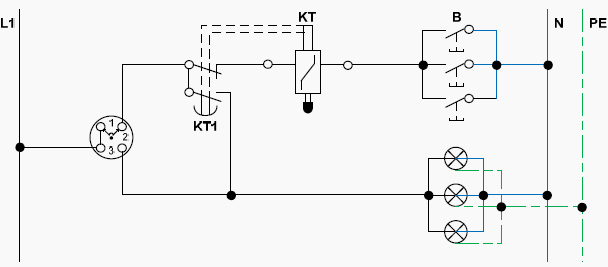
    Analytical diagram

    Lighting circuit controlled by an automatic staircase timer - Analytical diagram

    Lighting circuit controlled by an automatic staircase timer - Analytical diagram


    Go up to the Timers ↑


    Operating mode

    Press any button and the coil is activated with the neutral being transferred through that button to the end of the coil. At the other end of the button the phase is applied through the medium contact (2) of the mercurial ampoule and the contact on the right end (3).

    Once activated the coil repels the armature (and the whole system) upward. Therefore the mercury bulb changes position shorting out the other two contacts (1) and (2).The phase is transferred to contact (1), namely the luminaires.

    The coil is not enabled as long as we let the button and the armature descends due to the weight of the cartridge cavity.

    The more closed the tap is, the more slowly the armature descends. This way we regulate the time the lights will stay on.

    Operating diagram

    Lighting circuit controlled by an automatic staircase timer - Operating diagram

    Lighting circuit controlled by an automatic staircase timer - Operating diagram


    Obcservations

    The automatic staircase timer (ΚΤ), is a combination of an alternative three position switch and a time relay. The positions of the alternative switch are:

    • 1st position: For automatic operation
    • 2nd position: Permanent discontinuation
    • 3rd position: Permanent operation (e.g. when we want to clean the stairway)

    Go up to the Timers ↑


    Automatic operation

    Pressing any instant contact pushbutton (B) , the control circuit closes and the time relay (KT) is stimulated, which subsequently and through the alternative switch closes the power circuit (main circuit), whereby lights illuminate. After a preselected time (as much needed to bring the hydraulic system of the timer in its rest position), power supply of the power circuit is turned off, by opening the contact KT1 of the time relay.

    Important note: By observing both the analytical and the operational diagram, we can see that the Neutral (N) is common for the luminaries and the pushbuttons.

    Go up to the Timers ↑


    2. Lighting circuit controlled by an automatic staircase timer (electronic)

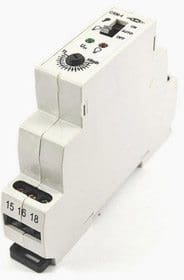
    Automatic staircase timer

    Automatic staircase timer


    Staircase timers are applied in any residential or commercial building wherever automatic control is required on predefined times.

    Lighting control in staircases made with automatic timers (bracket – rail profile), mounted in electrical switchboards at the staircase and activated by pushbuttons with light or no indication located in various places of the staircase or by motion detectors, which detect movements in the range of their surveillance and enable the automatic switch.

    Go up to the Timers ↑


    2.1 Staircase electronic timer (3 and 4 wire configuration)

    Staircase electronic timer ( 3 & 4 wire configuration)

    Staircase electronic timer ( 3 & 4 wire configuration)

    Important Note: One contact of the lights is permanently connected to the Neutral and the other one is connected to the return (for the lights) of the automatic timer.

    Operation mode

    When you press any button the automatic timer is activated (the Neutral is carried through the button and at his edges 230V voltage is applied) and the main contact closes for as long as we have preselected. At that time the lights will illuminate. The phase is transferred through the main contact of the automatic timer to the other end of the luminaires.

    Once this time has elapsed, the contact opens and the lights go out.

    Important Note: One contact of the buttons is permanently connected to the Neutral and the other one is connected to the return (for the buttons) of the automatic timer.

    Go up to the Timers ↑


    2.2 Staircase electronic multifunctional timer (3 and 4 wire configuration)

    Staircase electronic multifunctional timer (3 and 4 wire configuration)

    Staircase electronic multifunctional timer (3 and 4 wire configuration)


    Automatic staircase timers are manufactured for certain lamp wattage.

    They have timers so we can choose the interval we want them to be turned on. The multifunctional automatic staircase timers have the option of continuous operation when a button is pressed for more than two seconds and they can increase and decrease their luminance for twenty seconds after the end of regulation time, as a warning that the lights will turn off.

    Also, they have the option (changeover switch) to pose the circuit off or keep the lights permanently on.

    Some of the automatic multifunctional timers may have separate control input 8 – 240 V AC/DC, galvanic separated (e.g. intercom) and they can also automatically detect the 3 or 4 wire configuration.

    Important note:

    The automatic staircase timers can be connected with incandescent lamps, halogen lamps, single fluorescent lamps and compact fluorescent electronic lamps.

    The electronic staircase automatic timers have some advantages over the older ones.

    The most important of these are:
    1. Wide range time adjustment.
    2. Great confidence when they work as there is no fear to get stuck while operating.
    3. High accuracy of repeatability of the time. Time does not change if no intervening setting.
    4. Their small size gives them the potential to be installed inside the staircase’s electrical panel.

    Go up to the Timers ↑

    Thank you very much, wish you all the best in 2013!

    $
    0
    0

    EEP wishes you a Happy New Year and all the best in 2013!


    Well engineers, here we are… at the very end of this year!


    2012

    2012 was very active for us, that’s for sure. EEP’s team worked very hard during year and brought to you a plenty of interesting technical articles and new sections with usefull electrical engineering guides.

    I would specially  like to thank EEP’s most active writers this year:

    1. Jignesh Parmar
    2. Asif Eqbal,
    3. Bipul Raman
    4. Vinod Ramireddy
    5. Emmanouil Angeladas
    6. Prabakar S.

    for awsome articles they published. Great work buddies!


    2013

    EEP will continue to grow in 2013  and hopefully reach the 100,000 engineers registered! We are proud to say that we’re now on almost 36,000 engineers worldwide ;)

    We wish you all the best in coming 2013 and more #EE knowledge.

    And ohh… not to forget the jobs, we know how hard is to find the decent #EE job nowdays. We strongly advice you to work hard on yourself and your knowledge, success will surely come.

    See you in next year!

    The Future of MOS-Controlled Thyristor (MCT)

    $
    0
    0
    MOS Controlled Thyristor

    Figure 1 - MOS Controlled Thyristor

    The MCT is type of power semiconductor device that combines the capabilities of thyristor voltage and current with MOS gated turn-on and turn-off. It is a high power, high frequency, low conduction drop and a rugged device, which is more likely to be used in the future for medium and high power applications.

    A cross-sectional structure of a p-type MCT with its circuit schematic is shown in Fig. 1.

    The MCT has a thyristor type structure with three junctions and PNPN layers between the anode and cathode. In a practical MCT, about 100,000 cells similar to the one shown are paralleled to achieve the desired current rating.

    MCT is turned on by a negative voltage pulse at the gate with respect to the anode, and is turned off by a positive voltage pulse.

    The MCT was announced by the General Electric R & D Center on November 30, 1988.

    Harris Semiconductor Corporation has developed two generations of p-MCTs. Gen-1 p-MCTs are available at 65 A/1000 V and 75A/600 V with peak controllable current of 120 A. Gen-2 p-MCTs are being developed at similar current and voltage ratings, with much improved turn-on capability and switching speed.

    The reason for developing a p-MCT is the fact that the current density that can be turned off is 2 or 3 times higher than that of an n-MCT; but n-MCTs are the ones needed for many practical applications.

    The advantage of an MCT over IGBT is its low forward voltage drop. N-type MCTs will be expected to have a similar forward voltage drop, but with an improved reverse bias safe operating area and switching speed. MCTs have relatively low switching times and storage time. The MCT is capable of high current densities and blocking voltages in both directions.

    Since the power gain of an MCT is extremely high, it could be driven directly from logic gates. An MCT has high di/dt (of the order of 2500 A/μs) and high dv/dt (of the order of 20,000 V/μs) capability.

    The MCT, because of its superior characteristics, shows a tremendous possibility for applications such as motor drives, uninterrupted power supplies, static VAR compensators, and high power active power line conditioners.

    The current and future power semiconductor devices developmental direction is shown in Figure 2. High-temperature operation capability and low forward voltage drop operation can be obtained if silicon is replaced by silicon carbide material for producing power devices.

    Past and future power semiconductor devices development direction

    Past and future power semiconductor devices development direction


    The silicon carbide has a higher band gap than silicon. Hence, higher breakdown voltage devices could be developed.

    Silicon carbide devices have excellent switching characteristics and stable blocking voltages at higher temperatures. But the silicon carbide devices are still in the very early stages of development.

    Resource: Mark Nelms – Auburn University

    Lighting Circuits Connections for Interior Electrical Installations (3)

    $
    0
    0
    Emergency lighting circuits

    Lighting Circuits Connections for Interior Electrical Installations (part 3) - Emergency lighting circuits


    Continued from 2nd part: Lighting Circuits Connections for Interior Electrical Installations (2)


    Emergency lighting circuits

    The main reason for installing an emergency lighting system is to enable the building to meet fire safety legislation in a way that is visually acceptable and meets the user’s needs for ease of operation and maintenance.

    Consequently it is important to establish all the relevant legal requirements for emergency lighting and fire alarm systems before commencing the design these should ideally be agreed between the system designer, user, fire authority, building control officer and system installer.


    Wiring of emergency lighting system, two circuits A.C./D.C. interconnection

    Description:

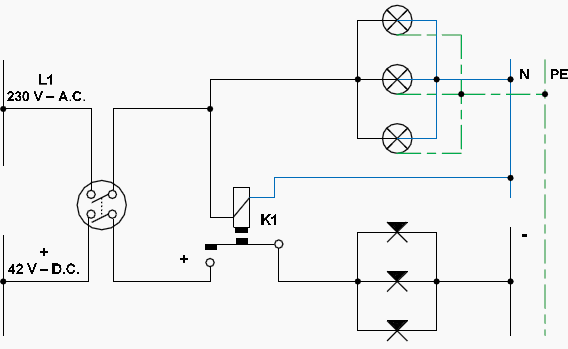
    The following wiring has two circuits, one A.C. 230 V and one D.C. of 24V or 42 V, respectively with appropriate lights. Constitutes one of the most common emergency lighting circuits for places that we want to avoid panic in case of power failure.

    An essential element for the operation of emergency lighting is a relay whose coil is powered from the grid voltage and the other contacts are connected at some point of the backup line.

    When there is voltage on the grid, the relay opens the backup circuit contacts and when the grid voltage is interrupted the relay closes his backup circuit contacts.


    General diagrams

    Operating diagram:

    Emergency lighting system - Operating diagram

    Emergency lighting system - Operating diagram

    Important note:

    The relay is controlled by the A.C. circuit while the D.C. circuit is supplied through the contact K1: 13 – 14. In the same sense, we can supply the D.C. circuit through another relay’s main contacts (e.g. K3: 1 – 2), to be controlled by the contact K1: 13 – 14.

    The emergency lighting is less powerful than the main lighting of the building and is composed by independent lamps or/and with some of the lamps of the main lighting circuit. On the premises that emergency lighting is required the voltage source is a battery bank, usually with 24 V or 42 V voltage level. The lamps provided for respective operating voltage.

    The array of the batteries according to the loads provided to supply, consists of one or more battery banks. In each group the batteries are connected in series to aggregate the required voltage.

    The batteries used are rechargeable and that’s why we construct a specific provision which continuously charging the batteries from the grid. This provision contains a transformer and a rectifier to convert the A.C. from the grid. (e.g. 230 V A.C. to 24, 42 V DC).

    Analytical diagram:

    Emergency lighting system - Analytical diagram

    Emergency lighting system - Analytical diagram

    Important note:

    If a central battery DC supply system is used for the Emergency Lighting System, it shall be operated at a normal battery voltage of not less than 24 V and not more than 120 V D.C. from a common bank.

    UPS (Uninterruptible Power Supply) based emergency lighting system

    In new facilities and in cases requiring continuous supply of electrical power and/or constant voltage and/or constant frequency, units of Uninterruptible Power Supply (UPS) are used.

    These units are inserted between the supply and the load.

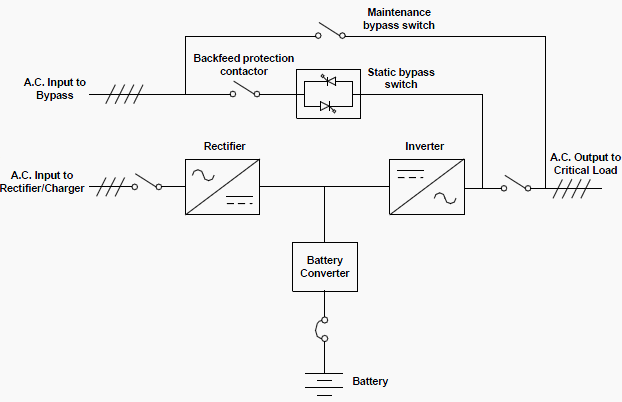
    The UPS maintains power to the critical loads during commercial electrical power brownout, blackout, overvoltage, undervoltage and out – of – tolerance frequency conditions. The basic system consists of a rectifier, battery converter, inverter, monitoring/operation control panel, integrated communication server and digital signal processor (DSP) logic.

    If utility power is interrupted or falls outside specific parameters, the UPS uses a backup battery supply to maintain power to the critical load (in our case the emergency lighting system) for a specified period of time or until the utility power returns.

    For extended power outages, the UPS allows you to either transfer to an alternative power system (such as a generator) or shut down your critical load in an orderly manner.

    UPS (Uninterruptible Power Supply) based emergency lighting system

    UPS (Uninterruptible Power Supply) based emergency lighting system


    The emergency lighting circuit is connected to the A.C. output of the UPS (whether single phase or three phase), as we saw in the previous circuits.

    The emergency bypass consists of a continuous – duty static switch and a backfeed protection contactor.

    The backfeed protection contactor is located in series with the static switch. For manual transfers to bypass, the static switch is also used. The static switch is armed and ready during both types of transfers.

    The UPS systems are distinguished by their electrical power in to main categories:

    1. Low power UPS

    Single phase UPS, with effect from 300VA to 10 KVA , used for the protection of personal computers, small and medium sized computer networks (servers), telecommunications equipment and security systems (e.g. emergency lighting, alarm systems, fire detection and extinguishing systems).


    2. High power UPS

    With three phase input and either a single phase output with effect from 5 KVA to 80 KVA or with a three phase output with effect from 80 KVA to 800 KVA.


    References:
    1. Andreas Goutis, ‘Electrical drawing, Part 1’
    2. EATON Powerware UPS ‘Installation and Operation Manual’
    3. DSPM INC. ‘Digital Signal Power Manufacturer’

    Brightness, Lamp Life and Efficiency of LED Fixtures

    $
    0
    0
    Brightness, lamp life and efficiency of LED fixtures

    Brightness, lamp life and efficiency of LED fixtures (on photo: Downlight 7 LED Fixture by TheLEDLight.com @ Flickr)

    Introduction

    A typical LED fixture comprises four major component parts: an LED emitter, the fixture’s heat sink, driver and dimming control, and augmenting optics.

    The emitter includes the die, a thermal heat sink, lens, and outer package (Figure 1). The die is the actual LED chip within the emitter.

    The color of the light is determined by the energy gap of this semiconductor. The thermal heat sink that is part of the emitter pulls the heat away from the chip and conducts it to the mass of the larger fixture (the fixture’s heat sink).

    The power supply electronics are designed to limit the drive current to the LED’s specifications. In this regard LEDs are very sensitive; too much current can shorten their useful life from 50,000 h to nothing in an instant.

    This is why manufacturers warn that the light should not be used above a certain temperature. Controlling drive current is critical to the LED’s brightness and useful life.

    LED emitter

    Figure 1 - LED emitter. At its center is a diode chip, the die, capable of converting electricity to light energy very efficiently. Heat is dissipated into the thermal heat sink. A silicon lens covers this chip.


    An LED is a current-driven device, meaning that the intensity of the light generated depends on the amount of electric current flowing through it. Fixture designers try to design their lights with as high a drive current as possible, but there is a three-way relationship between brightness, lamp life and the ability of the fixture to dissipate the heat.

    LEDs are brighter at a higher current, but they loose efficiency if their operating temperature is allowed to rise.

    The balance a fixture designer can strike will also depend on the limitations posed by the spacing of emitters, the efficiency of the heat management.

    This is why almost all LED devices have large heat sinks and fins.

    The lethal effect of overheating has prompted some manufacturers to provide safeguards against over-temperature situations by automatically increasing the speed of the cooling fan, and at some point, automatically reducing power or shutting off all together if the light approaches red-line, in order to draw the user’s attention to the heat issue.

    Typical 3 W LED bulb Construction

    Typical 3 W LED bulb Construction


    This can usually be remedied by providing shade or better ventilation.

    There are a couple different ways manufacturers can arrange the dimming. One way is to vary the drive current usually using pulse amplitude modulation (PAM). PAM is a method of current control that employs very high speed on/off switching to limit the current. By varying the timing of the switching the current can be lowered to dim the LED.

    A fixture dimmed using PAM will cut-out abruptly before it reaches full dim. The other way to dim LEDs is to use pulse width modulation (PWM) downstream of the driver. PWM modulates the intensity by varying the duty cycle at high frequency. This allows smooth dimming to nearly zero.

    For LED lights marketed for film and television, the frequency of the electronic power supplies, and PWM dimmer is typically greater than 20,000 Hz, and does not pose a risk of flicker at normal frame rates. Nila has actually done tests up to 7000 fps without capturing any flicker.

    However cheaper LEDs designed for the consumer market or club venues may use power supplies that cycle at 1 kHz or even lower, and these pose a definite risk of flicker, especially when the LED itself is being photographed at higher than normal frame rates. Testing is recommended.

    The optical components of the LED, lenses and reflectors, extract light from the chip and shape the projection of that light in a focused beam. A total internal reflection (TIR) lens is a small molded lens used to capture light that is emitted in 180 from the die, and form it into a manageable beam of light. Advances in optics accounted for the lion’s share of improvement in LED lumen output in the early years of their development.

    More recently improved chip technology and chemistry and better thermal management by the chip itself have contributed greatly to performance improvements.

    As mentioned previously, some LED fixtures use interchangeable optics. A thin sheet of glass covers the chip to protect it. The optics should be kept clean, however do not use solvents or window cleaner as these can have adverse reactions with the assembly. Manufacturers recommend using a soft rag with isopropyl alcohol to clean the protective glass. Use water with mild soap for the optics.


    Power factor

    Power factor may be a concern when using very large numbers of LEDs. Color Kinetics and NILA fixtures are fully power factor corrected. Many of the devices described in this chapter may or may not have power factor correction. If they do not, you might expect to see a power factor of about 0.70.

    In a large installation this could create a significant nonlinear load. Check manufacturer’s specifications.


    LED useful life

    LEDs very rarely just fail or suddenly burn out (unless seriously overheated). Normally they fade slowly over time, at a fairly consistent speed.

    Their useful life is defined in terms of lumen maintenance – the number of hours the emitter will operate on average before the lumen output decreases below a given percentage of initial light output.

    For example the emitter manufacturer will specify that an LED will produce at least 70% (denoted L70) of its initial output for 50,000 h, when driven at a particular current and a particular junction temperature. This is also sometimes stated as L75 or L50 (75% and 50% respectively).

    The L value that the manufacturer uses to produce their advertised lamp life figure makes a big difference. As a practical matter, a light that puts out less than 70% of its initial output would be considered pretty useless in our business. Depending how the light designer configures the electronics and heat dissipation, and exactly which LEDs they choose the estimated lamp life can vary quite a bit.

    Manufacturers of lights used in our industry advertise lamp life from 20,000 to 100,000 hours. If you ran a 50,000-hour LED 8 hours a day, every day including weekends and holidays, the light would lose 10% of the initial output in about 6 years. At that rate, it would take a little over 17 years to reach 70% output.

    Of course once the LEDs are worn out, you just have to replace the whole fixture. Another factor that is easily overlooked in all this is that in theory the circuit components employed in the drive electronics have a shorter mean time to failure than the LEDs themselves, and may end up being the weakest link.


    LED Lighting Technology Overview (VIDEO)

    Cant see this video? Click here to watch it on Youtube.

    Resource: Lighting Equipment, Practice, and Electrical Distribution – Harry C. Box (get book at Amazon)

    Geographical Variation in the Wind Resource

    $
    0
    0
    Geographical Variation in the Wind Resource

    Geographical Variation in the Wind Resource (photo by Chris Jones @ Flickr)

    Wind

    Ultimately the winds are driven almost entirely by the sun’s energy, causing differential surface heating.

    The heating is most intense on land masses closer to the equator, and obviously the greatest heating occurs in the daytime, which means that the region of greatest heating moves around the earth’s surface as it spins on its axis.

    Warm air rises and circulates in the atmosphere to sink back to the surface in cooler areas. The resulting large-scale motion of the air is strongly influenced by coriolis forces due to the earth’s rotation. The result is a large-scale global circulation pattern.

    Certain identifiable features of this such as the trade winds and the ‘roaring forties’ are well known.

    The non-uniformity of the earth’s surface, with its pattern of land masses and oceans, ensures that this global circulation pattern is disturbed by smaller-scale variations on continental scales. These variations interact in a highly complex and nonlinear fashion to produce a somewhat chaotic result, which is at the root of the day-to-day unpredictability of the weather in particular locations.

    Clearly though, underlying tendencies remain which lead to clear climatic differences between regions. These differences are tempered by more local topographical and thermal effects.

    Hills and mountains result in local regions of increased wind speed. This is partly a result of altitude – the earth’s boundary layer means that wind speed generally increases with height above ground, and hill tops and mountain peaks may ‘project’ into the higher wind-speed layers.

    It is also partly a result of the acceleration of the wind flow over and around hills and mountains, and funnelling through passes or along valleys aligned with the flow.

    Equally, topography may produce areas of reduced wind speed, such as sheltered valleys, areas in the lee of a mountain ridge or where the flow patterns result in stagnation points.

    Seasional World Wind Resource Map

    Seasional World Wind Resource Map (in january and july)

    Thermal effects

    Thermal effects may also result in considerable local variations. Coastal regions are often windy because of differential heating between land and sea.

    While the sea is warmer than the land, a local circulation develops in which surface air flows from the land to the sea, with warm air rising over the sea and cool air sinking over the land. When the land is warmer the pattern reverses. The land will heat up and cool down more rapidly than the sea surface, and so this pattern of land and sea breezes tends to reverse over a 24 h cycle.

    These effects were important in the early development of wind power in California, where an ocean current brings cold water to the coast, not far from desert areas which heat up strongly by day. An intervening mountain range funnels the resulting air flow through its passes, generating locally very strong and reliable winds (which are well correlated with peaks in the local electricity demand caused by air-conditioning loads).

    Thermal effects may also be caused by differences in altitude. Thus cold air from high mountains can sink down to the plains below, causing quite strong and highly stratified ‘downslope’ winds.


    Long-term Wind speed Variations

    There is evidence that the wind speed at any particular location may be subject to very slow long-term variations. Although the availability of accurate historical records is a limitation, careful analysis by, for example, Palutikoff, Guo and Halliday (1991) has demonstrated clear trends.

    Clearly these may be linked to long term temperature variations for which there is sample historical evidence.

    There is also much debate at present about the likely effects of global warming, caused by human activity, on climate, and this will undoubtedly affect wind climates in the coming decades.

    Apart from these long-term trends there may be considerable changes in windiness at a given location from one year to the next. These changes have many causes. They may be coupled to global climate phenomema such as el nin˜o, changes in atmospheric particulates resulting from volcanic eruptions, and sunspot activity, to name a few.

    These changes add significantly to the uncertainty in predicting the energy output of a wind farm at a particular location during its projected lifetime.

    Resource: Wind Energy Handbook – Tony Burton (Wind Energy Consultant, Carno, UK)
    (Get this book from Amazon)


    Transformer Routine Test – Measurement of Winding Resistance

    $
    0
    0
    BEST Transformers - OSB Power Transformers Test Laboratory

    BEST Transformers - OSB Power Transformers Test Laboratory

    Calculating Load Loss Values

    Measurement is made to check transformer windings and terminal connections and also both to use as reference for future measurements and to calculate the load loss values at reference (e.g. 75ºC) temperature.

    Measuring the winding resistance is done by using DC current and is very much dependent on temperature.

    Temperature correction is made according to the equations below:

    Temperature correction formulas for copper and aluminium windings

    R2 – winding resistance at temperature t2,
    R1 – winding resistance at temperature t1

    Because of this, temperatures must be measured when measuring the winding resistances and temperature during measurement should be recorded as well.

    Winding resistances are measured between all connection terminals of windings and at all tap positions. During this, winding temperature should also be appropriately measured and recorded.

    The measuring current can be obtained either from a battery or from a constant (stable) current source. The measuring current value should be high enough to obtain a correct and precise measurement and small enough not to change the winding temperature.

    In practice, this value should be larger than 1,2 x I0 and smaller than 0,1 x IN, if possible.

    A transformer consists of a resistance R and an inductance L connected in serial. If a voltage U is applied to this circuit;

    The value of current measurement will be :

    Value of current measurement

    Here, the time coefficient depends on L/R ratio.

    As the measurement current increases, the core will be saturated and inductance will decrease. In this way, the current will reach the saturation value in a shorter time.

    After the current is applied to the circuit, it should be waited until the current becomes stationary (complete saturation) before taking measurements, otherwise, there will be measurement errors.


    Measuring circuit and performing the measurement

    The transformer winding resistances can be measured either by current-voltage method or bridge method. If digital measuring instruments are used, the measurement accuracy will be higher.

    Measuring by the current-voltage method is shown in figure 1 below:

    Measuring the resistance by Current-Voltage method

    Figure 1 - Measuring the resistance by Current-Voltage method


    In the current – voltage method, the measuring current passing through the winding also passes through a standard resistor with a known value and the voltage drop values on both resistors (winding resistance and standard resistance) are compared to find the unknown resistance (winding resistance).

    One should be careful not to keep the voltage measuring voltmeter connected to the circuit to protect it from high voltages which may occur during switching the current circuit on and off.

    The bridge method is based on comparing an unknown (being measured) resistor with a known value resistor.

    When the currents flowing in the arms are balanced, the current through the galvanometer will be zero. In general, if the small value resistors (e.g. less than ≤1 ohm) are measured with a Kelvin bridge and higher value resistors are measured with a Wheatstone bridge, measurement errors will be minimised.

    Kelvin bridge; Wheatstone bridge

    Figure 2 (left) - Kelvin bridge; Figure 3 (right) - Wheatstone bridge


    The resistance measured with the Kelvin Bridge:

    Resistance measured with the Kelvin Bridge

    The resistance measured with the Wheatstone Bridge:

    Resistance measured with the Wheatstone Bridge


    BEST Transformers laboratory

    BEST Transformers - OSB Laboratory

    BEST Transformers - OSB Laboratory


    BEST Test laboratory is equipped with the most advanced testing facilities and is capable of conducting all tests required by IEC standards except short circuit mechanical withstand test, conducted in an independent international laboratory, CESI-Italy.

    Tests performed on the transformers can be classified as follows:

    Tests during manufacturing, routine tests, type tests, special tests, acceptance tests, site tests, defect analysis / identification and tests before maintenance.

    Resource: BEST Transformer – Tests (BALIKESİR ELEKTROMEKANİK SANAYİ TESİSLERİ A.Ş.)

    Environmental Stresses On External Insulation

    $
    0
    0
    Environmental Stresses On External Insulation

    Environmental Stresses On External Insulation (on photo: Workers on transmission tower 1953. Two workers standing without the use of safety lines atop a transmission tower in the R line during its construction on Kildala Pass.)

    Introduction To External Insulation

    The external insulation (transmission line or substation) is exposed to electrical, mechanical, and environmental stresses. The applied voltage of an operating power system produces electrical stresses. The weather and the surroundings (industry, rural dust, oceans, etc.) produce additional environmental stresses.

    The conductor weight, wind, and ice can generate mechanical stresses.

    The insulators must withstand these stresses for long periods of time. It is anticipated that a line or substation will operate for more than 20–30 years without changing the insulators.

    However, regular maintenance is needed to minimize the number of faults per year. A typical number of insulation failure-caused faults is 0.5–10 per year, per 100 mi of line.

    Environmental Stresses

    Most environmental stress is caused by weather and by the surrounding environment, such as industry, sea, or dust in rural areas. The environmental stresses affect both mechanical and electrical performance of the line.


    1. Temperature

    The temperature in an outdoor station or line may fluctuate between –50°C and +50°C, depending upon the climate. The temperature change has no effect on the electrical performance of outdoor insulation.

    It is believed that high temperatures may accelerate aging. Temperature fluctuation causes an increase of mechanical stresses, however it is negligible when well-designed insulators are used.


    2. UV Radiation

    UV radiation accelerates the aging of nonceramic composite insulators, but has no effect on porcelain and glass insulators. Manufacturers use fillers and modified chemical structures of the insulating material to minimize the UV sensitivity.


    3. Rain

    Beads of rainwater on the silicone rubber surface of a high voltage insulator

    Beads of rainwater on the silicone rubber surface of a high voltage insulator (photo by electropod @ Flickr)


    Rain wets porcelain insulator surfaces and produces a thin conducting layer most of the time. This reduces the flashover voltage of the insulators. As an example, a 230-kV line may use an insulator string with 12 standard ball-and-socket-type insulators.

    Dry flashover voltage of this string is 665 kV and the wet flashover voltage is 502 kV. The percentage reduction is about 25%. Nonceramic polymer insulators have a water-repellent hydrophobic surface that reduces the effects of rain.

    As an example, with a 230-kV composite insulator, dry flashover voltage is 735 kV and wet flashover voltage is 630 kV. The percentage reduction is about 15%. The insulator’s wet flashover voltage must be higher than the maximum temporary overvoltage.

    4. Icing

    A power employee hammers at the ice covering a pylon, insulators and conductors

    A power employee hammers at the ice covering a pylon, insulators and conductors


    In industrialized areas, conducting water may form ice due to water-dissolved industrial pollution.

    An example is the ice formed from acid rain water. Ice deposits form bridges across the gaps in an insulator string that result in a solid surface. When the sun melts the ice, a conducting water layer will bridge the insulator and cause flashover at low voltages.

    Melting ice-caused flashover has been reported in the Quebec and Montreal areas.


    5. Pollution

    Wind drives contaminant particles into insulators. Insulators produce turbulence in airflow, which results in the deposition of particles on their surfaces. The continuous depositing of the particles increases the thickness of these deposits.

    However, the natural cleaning effect of wind, which blows loose particles away, limits the growth of deposits. Occasionally, rain washes part of the pollution away.

    The continuous depositing and cleaning produces a seasonal variation of the pollution on the insulator surfaces. However, after a long time (months, years), the deposits are stabilized and a thin layer of solid deposit will cover the insulator.

    Insulator pollution

    Insulator pollution

    Because of the cleaning effects of rain, deposits are lighter on the top of the insulators and heavier on the bottom. The development of a continuous pollution layer is compounded by chemical changes. As an example, in the vicinity of a cement factory, the interaction between the cement and water produces a tough, very sticky layer.

    Around highways, the wear of car tires produces a slick, tar-like carbon deposit on the insulator’s surface.

    Moisture, fog, and dew wet the pollution layer, dissolve the salt, and produce a conducting layer, which in turn reduces the flashover voltage. The pollution can reduce the flashover voltage of a standard insulator string by about 20–25%.

    Near the ocean, wind drives salt water onto insulator surfaces, forming a conducting salt-water layer which reduces the flashover voltage. The sun dries the pollution during the day and forms a white salt layer. This layer is washed off even by light rain and produces a wide fluctuation in pollution levels.

    The Equivalent Salt Deposit Density (ESDD) describes the level of contamination in an area. Equivalent Salt Deposit Density is measured by periodically washing down the pollution from selected insulators using distilled water. The resistivity of the water is measured and the amount of salt that produces the same resistivity is calculated. The obtained mg value of salt is divided by the surface area of the insulator. This number is the ESDD.

    The pollution severity of a site is described by the average ESDD value, which is determined by several measurements.

    Table 1 shows the criteria for defining site severity.

    The contamination level is light or very light in most parts of the U.S. and Canada. Only the seashores and heavily industrialized regions experience heavy pollution.

    Table 1 – Site Severity (IEEE Definitions)

    DescriptionESDD (mg/cm2)
    Very light0–0.03
    Light0.03–0.06
    Moderate0.06–0.1
    Heavy<0.1

    Table 2 – Typical Sources of Pollution

    Pollution TypeSource of PollutantDeposit CharacteristicsArea
    Rural areasSoil dustHigh resitivity layer, effective rain washingLarge areas
    DesertSandLow resistivityLarge areas
    Coastal areaSea saltVery low resistivity, easily washed by rain10–20 km from the sea
    IndustrialSteel mill, coke plants, chemical plants, generating stations, quarriesHigh conductivity, extremely difficult to remove, insolubleLocalized to the plant area
    MixedIndustry, highway, desertVery adhesive, medium resistivityLocalized to the plant area

    Typically, the pollution level is very high in Florida and on the southern coast of California. Heavy industrial pollution occurs in the industrialized areas and near large highways.

    Table 2 gives a summary of the different sources of pollution. The flashover voltage of polluted insulators has been measured in laboratories. The correlation between the laboratory results and field experience is weak. The test results provide guidance, but insulators are selected using practical experience.


    6. Altitude

    Insulator damage caused by heat of the flashover

    A closeup shows the damage caused by the heat of the flashover, it actually shattered the ceramic all around the edges of the insulator:


    The insulator’s flashover voltage is reduced as altitude increases. Above 1500 feet, an increase in the number of insulators should be considered. A practical rule is a 3% increase of clearance or insulator strings’ length per 1000 ft as the elevation increases.


    Maintenance Of The Insulators

    In zones where there is pollution, besides a good election of the insulator, is advisable to have a maintenance plan.

    In other words, we need to wash or clean the insulator.

    Cant see this video? Click here to watch it on Youtube.

    This is more important in areas with severe environments of pollution or low rain probability, being necessary the elimination of the pollutant layer placed on the insulator.

    This maintenance can be carried out with the system energized, wash in hot, or de-energized. The later method is used when cannot be applied another method by technical reasons or when the adhesive characteristics of the pollutant, require the use of wash with chemical solutions to recover the insulation level.

    Many times, the wash is carried out by hand. In general the most employed methods are: the wash by water to high, average or low pressure, with dry air compressed or with spurts of abrasive materials and more recently the use of ultrasonic.

    Any of the techniques used has to guarantee that the insulator will not suffer damage, neither that we are going to get worse the present situation.

    The wash with spurts of water is the most effective and economic method, if the contaminant is dust, salt or land, or if these pollutants are not much adhered to the surface.

    If the contaminant element has a high adhesion, (for example the cement or pollutant originating from chemical businesses or by-products of the petroleum) we have to wash the insulator with abrasive elements. They can be smooth elements, as shattered shell of cobs of corn or shells of nut, fine dust of lime, or more abrasive elements as the fine sand.

    Always the opinion of the manufacturer will be kept in mind for not damaging the surface of the insulator.

    To prevent the flashover during the wash, the following observations have to be considered:
    1. The wash of the insulator will begin from lowest phase conductive.
    2. When we wash, the water should not fall directly on a dirty insulator.
    3. We will begin to wash from the lower part of the insulator until finishing in the upper part.
    4. Is very important to keep in mind the direction of the wind.

    Resources:
    1. George G. Karady and R.G. Farmer | The electric power engineering – L L Grisby
    2. Insulator pollution in transmission lines – Ramos Hernanz, José A., Campayo Martín, José J., Motrico Gogeascoechea

    Testing and Commissioning of Substation DC System

    $
    0
    0
    Testing and Commissioning of Substation DC System

    Testing and Commissioning of Substation DC System (on photo: The battery assembly rated at 108V 200AH, 55 Tungstone Plante Cells all fitted with Aquagen catalytic recombination fillers, which effectively reduce topping up to less than once a year.- by prepair.co.uk)

    Objective

    Power substation DC system consists of battery charger and battery. This is to verify the condition of battery and battery charger and commissioning of them.


    Test Instruments Required

    Following instruments will be used for testing:

    1. Multimeter. (Learn how to use it)
    2. Battery loading unit (Torkel-720 (Programma Make) or equivalent.
      The Torkel-720is capable of providing a constant current load to the battery under test.

      Torkel 720 Battery Load Capacity Tester Front View

      Torkel 720 Battery Load Capacity Tester Front View


    Commissionig Test Procedure

    1. Battery Charger

    1. Visual Inspection: The battery charger cleanliness to be verified. Proper cable termination of incoming AC cable and the outgoing DC cable and the cable connection between battery and charger to be ensured. A stable incoming AC supply to the battery charger is also to be ensured.
    2. Voltage levels in the Float charge mode and the Boost charge mode to be set according to specifications using potentiometer provided.
    3. Battery low voltage, Mains ‘Off”, charger ‘Off’ etc., conditions are simulated and checked for proper alarm / indication. Thus functional correctness of the battery charger is ensued.
    4. Charger put in Commissioning mode for duration specified only one time during initial commissioning of the batteries. (By means of enabling switch.)
    5. Battery charger put in fast charging boost mode and battery set boost charged for the duration specified by the battery manufacturer.
    6. After the boost charging duration, the battery charger is to be put in float charging (trickle charge) mode for continuous operation.
      Some chargers automatically switch to float charge mode after the charging current reduces below a certain value.
    7. Voltage and current values are recorded during the boost charging and float-charging mode.
    NiCad Batteries being regenerated

    NiCad Batteries being charged


    This test establishes the correct operation of the battery charger within the specified voltage and current levels in various operational modes.

    Calculate size of battery bank and inverter – Get MS Excel Spreadsheet!

    2. Battery Unit

    1. Mandatory Condition: The battery set should have been properly charged as per the commissioning instructions of the battery manufacturer for the duration specified.
    2. Visual Inspection: Cleanliness of battery is checked and the electrolyte level checked as specified on the individual cells. The tightness of cell connections on individual terminals should be ensured.
    3. The load current, minimum voltage of battery system, ampere-hour, duration etc., is preset in the test equipment using the keypad.
      For (e.g.) a 58 AH battery set, 5 Hr. duration specification 11.6 A and 5 Hr. duration are set. Minimum voltage setting is = No. of cells x end cell voltage of cells as per manufacturer specification.
    4. It is to be ensured that the set value of the current and duration is within the discharge capacity of the type of cell used. Also the total power to be dissipated in the load unit should be within the power rating of the battery load kit.
    5. Individual cell voltages to be recorded before the start of the test.
    6. Battery charger to be switched off/load MCB in charger to be switched off.
    7. Loading of the battery to be started at the specified current value.
      Individual cell voltages of the battery set are to be recorded every half an hour.
    8. It is to be ensured that all the cell voltages are above the end-cell voltage specified by the manufacturer.
      If any of the cell voltages falls below the threshold level specified by the manufacturer, this cell number is to be noted and the cell needs to be replaced.
    9. Test set automatically stops loading after set duration (or) when minimum voltage reached for the battery set.
    10. Test to be continued until the battery delivers the total AH capacity it is designed for.
      Value of AH and individual cell voltages to be recorded every half an hour.

    Acceptance Limits

    This test establishes the AH capacity of battery set at required voltage.

    The acceptance limit for the test is to ensure the battery set is capable of supplying the required current at specified DC voltage without breakdown for the required duration.

    Resource: Procedures for Testing and Commissioning of Electrical Equipment – Schnedeider Electric

    Generalities and Discrimination Between RCDs

    $
    0
    0
    Generalities and Discrimination Between RCDs

    Generalities and Discrimination Between Residual Current Devices (RCDs)

    Generalities on Residual Current Circuit-Breakers

    The operating principle of the residual current release is basically the detection of an earth fault current, by means of a toroid transformer which embraces all the live conductors, included the neutral if distributed.

    In absence of an earth fault, the vectorial sum of the currents IΔ is equal to zero.

    In case of an earth fault, if the IΔ value exceeds the rated residual operating current IΔn, the circuit at the secondary side of the toroid sends a command signal to a dedicated opening coil causing the tripping of the circuit-breaker.

    Operating principle of the residual current device

    Figure 1 - Operating principle of the residual current device

    Classifications of RCDs

    A first classification of RCDs can be made according to the type of the fault current they can detect:

    1. AC type: the tripping is ensured for residual sinusoidal alternating currents, whether suddenly applied or slowly rising;
    2. A type: tripping is ensured for residual sinusoidal alternating currents and residual pulsating direct currents, whether suddenly applied or slowly rising;
    3. B type: tripping is ensured for residual direct currents, for residual sinusoidal alternating currents and residual pulsating direct currents, whether suddenly applied or slowly rising.

    Another classification referred to the operating time delay is:

    1. Undelayed type;
    2. Time delayed S-type.

    RCDs can be coupled, or not, with other devices; it is possible to distinguish among:

    1. Pure residual current circuit-breakers (RCCBs)
      They have only the residual current release and can protect only against earth fault. They must be coupled with thermomagnetic circuit-breakers or fuses, for the protection against thermal and dynamical stresses;
    2. Residual current circuit-breakers with overcurrent protection (RCBOs)
      They are the combination of a thermomagnetic circuit-breaker and a RCD; for this reason, they provide the protection against both overcurrents as well as earth fault current;
    3. Residual current circuit-breakers with external toroid
      They are used in industrial plants with high currents.

    They are composed by a release connected to an external toroid with a winding for the detection of the residual current; in case of earth fault, a signal commands the opening mechanism of a circuit-breaker or a line contactor.

    RCD Operation

    Given IΔn the operating residual current, a very important parameter for residual current devices is the residual non-operating current, which represents the maximum value of the residual current which does not cause the circuit-breaker trip; it is equal to 0.5 IΔn.

    Therefore, it is possible to conclude that:

    • for IΔ < 0.5⋅IΔn the RCD shall not operate;
    • for 0.5⋅IΔn < IΔ < IΔn the RCD could operate;
    • for IΔ > IΔn the RCD shall operate.

    For the choice of the rated operating residual current, it is necessary to consider, in addition to the coordination with the earthing system, also the whole of the leakage currents in the plant.

    Their vectorial sums on each phase shall not be greater than 0.5⋅IΔn. in order to avoid unwanted tripping.


    Discrimination between RCDs

    The Standard IEC 60364-5-53 states that discrimination between residual current protective devices installed in series may be required for service reasons, particularly when safety is involved, to provide continuity of supply to the parts of the installation not involved by the fault, if any.

    This discrimination can be achieved by selecting and installing RCDs in order to provide the disconnection from the supply by the RCD closest to the fault.

    There are two types of discrimination between RCDs:

    Horizontal discrimination

    Horizontal discrimination between RCDs

    Figure 2 - Horizontal discrimination between RCDs


    It provides the protection of each line by using a dedicated residual current circuit-breaker; in this way, in case of earth fault, only the faulted line is disconnected, since the other RCDs do not detect any fault current.

    However, it is necessary to provide protective measures against indirect contacts in the part of the switchboard and of the plant upstream the RCD;


    Vertical discrimination

    Vertical discrimination between RCDs

    Figure 3 - Vertical discrimination between RCDs


    It is realized by using RCDs connected in series.

    Conditions

    According to IEC 60364-5-53, to ensure discrimination between two residual current protective devices in series, these devices shall satisfy both the following conditions:

    1. The non-actuating time-current characteristic of the residual current protective device located on the supply side (upstream) shall lie above the total operating time-current characteristic of the residual current protective device located on the load side (downstream);
    2. The rated residual operating current on the device located on the supply side shall be higher than that of the residual current protective device located on the load side.

    The Non-Actuating Time-Current Characteristic

    The non-actuating time-current characteristic is the curve reporting the maximum time value during which a residual current greater than the residual non-operating current (equal to 0.5.IΔn) involves the residual current circuit breaker without causing the tripping.

    As a conclusion, discrimination between two RCDs connected in series can be achieved:
    1. For S type residual current circuit-breakers, located on the supply side, (complying with IEC 61008-1 and IEC 61009), time-delayed type, by choosing general type circuit-breakers located downstream with IΔn equal to one third of IΔn of the upstream ones;
    2. For electronic residual current releases by choosing the upstream device with time and current thresholds directly greater than the downstream device, keeping carefully into consideration the tolerances.

    For the protection against indirect contacts in distribution circuits in TT system, the maximum disconnecting time at IΔn shall not exceed 1 s (IEC 60364-4-41, §413.1)

    Resource: Electrical Installation Handbook (part II) – ABB

    Testing and Commissioning of MV/HV Cables

    $
    0
    0
    Testing and Commissioning of MV/HV Cables

    Example of asbestos paper insulation wrap on high-voltage cable inside an underground cable vault. Several layers of the soft and friable insulation are wrapped around the cable in long, wide strips. Originally, pure white, the discoloration is from sediment mud after formerly being submerged in the once flooded vault; some water leakage is still present.

    1. Visual and Mechanical Inspection

    1. Compare cable data with drawings and specifications.
    2. Inspect exposed sections of cables for physical damage.
    3. Inspect bolted electrical connections for high resistance using one or more of the following methods:
      1. Use of a low-resistance ohmmeter in accordance with Section 1.2 above.
      2. Verify tightness of accessible bolted electrical connections by calibrated torque-wrench method in accordance with manufacturer’s published data or Table 100.12.
      3. Perform a thermographic survey.
        (NOTE: Remove all necessary covers prior to thermographic inspection. Use appropriate caution, safety devices, and personal protective equipment.)
    4. Inspect compression-applied connectors for correct cable match and indentation.
    5. Inspect shield grounding, cablesupports, and terminations.
    6. Verify that visible cable bends meet or exceed ICEA and manufacturer’s minimum published bending radius.
    7. Inspect fireproofing in common cable areas. (**)
    8. If cables are terminated through window-type current transformers, inspect to verify that neutral and ground conductors are correctly placed and that shields are correctly terminated for operation of protective devices.
    9. Inspect for correct identification and arrangements.
    10. Inspect cable jacket and insulation condition.

    ** Optional test

    2. Electrical Tests

    1. Perform resistance measurements through bolted connections with a low-resistance ohmmeter, if applicable, in accordance with Section 1.1.
    2. Perform an insulation-resistance test individually on each conductor with all other conductors and shields grounded. Apply voltage in accordance with manufacturer’s published data. In the absence of manufacturer’s published data, use Table 100.1.
    3. Perform a shield-continuity test on each power cable.
    4. In accordance with ICEA, IEC, IEEE and other power cable consensus standards, testing can be performed by means of direct current, power frequency alternating current, or very low frequency alternating current. These sources may be used to perform insulation-withstand tests, and baseline diagnostic tests suchas partial discharge analysis, and power factor or dissipation factor. The selection shall be made after an evaluation of the available test methods and a review of the installed cable system.
      .
      Some ofthe available test methods are listed below:
      .
      1. Dielectric Withstand:
        1. Direct current (DC) dielectric withstand voltage
        2. Very low frequency (VLF) dielectric withstand voltage
        3. Power frequency (50/60 Hz) dielectric withstand voltage
      2. Baseline Diagnostic Tests:
        1. Power factor/ dissipation factor (tan delta):
          1. Power frequency (50/60 Hz)
          2. Very low frequency (VLF)
        2. DC insulation resistance:
        3. Off-line partial discharge:
          1. Power frequency (50/60 Hz)
          2. Very low frequency (VLF)

    3. Test Values

    3.1 Test Values – Visual and Mechanical

    1. Compare bolted connection resistance values to values of similar connections. Investigate values which deviate from those of similar bolted connections by more than 50 percent of the lowest value.
    2. Bolt-torque levels should be in accordance with manufacturer’s published data. In the absence of manufacturer’s published data, use Table 100.12.
    3. Results of the thermographic survey.
      (NOTE: Remove all necessary covers prior to thermographic inspection. Use appropriate caution, safety devices, and personal protective equipment.)
    4. The minimum bend radius to which insulated cables may be bent for permanent training shall be in accordance with Table 100.22.

    3.2 Test Values – Electrical

    1. Compare bolted connection resistance values to values of similar connections. Investigate values which deviate from those of similar bolted connections by more than 50 percent of the lowest value.
    2. Insulation-resistance values shall be in accordance with manufacturer’s published data. In the absence of manufacturer’s published data, use Table 100.1.Values of insulation resistance less than this table or manufacturer’s recommendations should be investigated.
    3. Shielding shall exhibit continuity. Investigate resistance values in excess of ten ohms per 1000 feet of cable.
    4. If no evidence of distress or insulation failure is observed by the end of the total time of voltage application during the dielectric withstand test, the test specimen is considered to have passed the test.
    5. Based on the test methodology chosen, refer to applicable standards or manufacturer’s literature for acceptable values.

    Tables

    Table 100.12.1

    Bolt-Torque Values for Electrical Connections

    - US Standard Fasteners (a)
    - Heat-Treated Steel – Cadmium or Zinc Plated (b)

    Bolt-Torque Values for Electrical Connections

    Table 100.12.1 - Bolt-Torque Values for Electrical Connections


    a) Consult manufacturer for equipment supplied with metric fasteners.
    b) Table is based on national coarse thread pitch.


    Table 100.12.2

    - US Standard Fasteners (a)
    - Silicon Bronze Fasteners (b, c)

    Torque (Pound-Feet)

    Torque (Pound-Feet)

    Torque (Pound-Feet)


    a) Consult manufacturer for equipment supplied with metric fasteners.
    b) Table is based on national coarse thread pitch.
    c) This table is based on bronze alloy bolts having a minimum tensile strength of 70,000 pounds per square inch.


    Table 100.12.3

    - US Standard Fasteners (a)
    - Aluminum Alloy Fasteners (b, c)

    Torque (Pound-Feet)

    Torque (Pound-Feet) - Aluminum Alloy Fasteners

    Torque (Pound-Feet) - Aluminum Alloy Fasteners


    a) Consult manufacturer for equipment supplied with metric fasteners.
    b) Table is based on national coarse thread pitch.
    c) This table is based on aluminum alloy bolts having a minimum tensile strength of 55,000 pounds per
    square inch.


    Table 100.12.4

    - US Standard Fasteners (a)
    - Stainless Steel Fasteners (b, c)

    Torque (Pound-Feet)

    Torque (Pound-Feet) - Stainless Steel Fasteners

    Torque (Pound-Feet) - Stainless Steel Fasteners


    a) Consult manufacturer for equipment supplied with metric fasteners.
    b) Table is based on national coarse thread pitch.
    c) This table is to be used for the following hardware types:

    • Bolts, cap screws, nuts, flat washers, locknuts (18-8 alloy)
    • Belleville washers (302 alloy).

    Tables in 100.12 are compiled from Penn-Union Catalogue and Square D Company, Anderson Products Division, General Catalog: Class 3910 Distribution Technical Data, Class 3930 Reference Data Substation Connector Products.


    Table 100.1

    Insulation Resistance Test Values Electrical Apparatus and Systems

    Insulation Resistance Test Values Electrical Apparatus and Systems

    Table 100.1 - Insulation Resistance Test Values Electrical Apparatus and Systems


    In the absence of consensus standards dealing with insulation-resistance tests, the Standards Review Council suggests the above representative values. Test results are dependent on the temperature of the insulating material and the humidity of the surrounding environment at the time of the test.

    Insulation-resistance test data may be used to establish a trending pattern. Deviations from the baseline information permit evaluation of the insulation.


    Table 100.22

    Minimum Radii for Power Cable

    Single and Multiple Conductor Cables with Interlocked Armor, Smooth or Corrugated Aluminum Sheath or Lead Sheath

    Minimum Radii for Power Cable

    Table 100.22 - Minimum Radii for Power Cable


    ANSI/ICEA S-93-639/NEMA WC 74-2000, 5-46 kV Shielded Power Cable for Use in the Transmission and Distribution of Electric Energy, Appendix I – Recommended Bending Radii for Cables and Table I1 – Minimum Radii for Power Cable.

    a. 12 x individual shielded conductor diameter, or 7 x overall cable diameter, whichever is greater.

    Resource: STANDARD FOR ACCEPTANCE TESTING SPECIFICATIONS for Electrical Power Equipment and Systems (NETA 2009)

    Viewing all 1475 articles
    Browse latest View live